Solving Memory Leaks Issues in Ionic Angular Part II

Introduction
One of our mobile apps used by tens of thousands of retailers in Egypt is suffering in performance, mainly in the SupplierProducts page which lists the products sold by a specific supplier. Most of the complaints indicate that the app performance degrades while navigating through multiple suppliers. And eventually, the app crashes. Usually, this is a symptom for memory leaks [1].
Debugging Process
Under Chrome Developer tools, recording a heap allocation timeline and using the performance monitor provide strong insights about what is happening according to memory allocations.
Heap Allocation Timeline
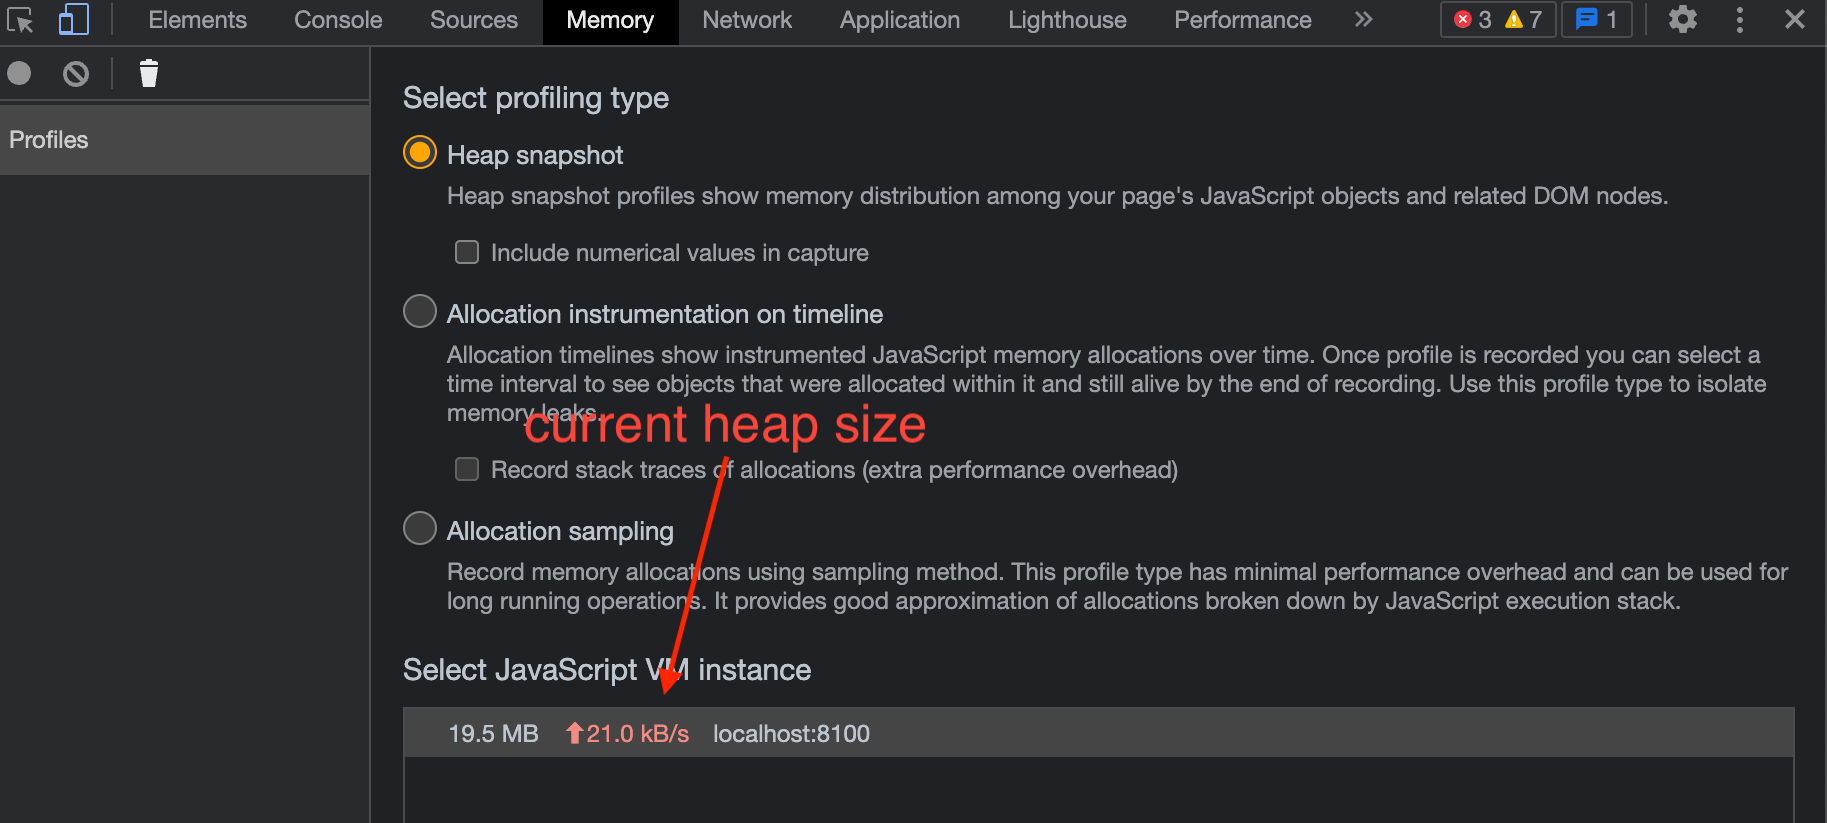
Before starting to record heap allocation, I made sure to take a note of the current heap size and it was 19.5MB.
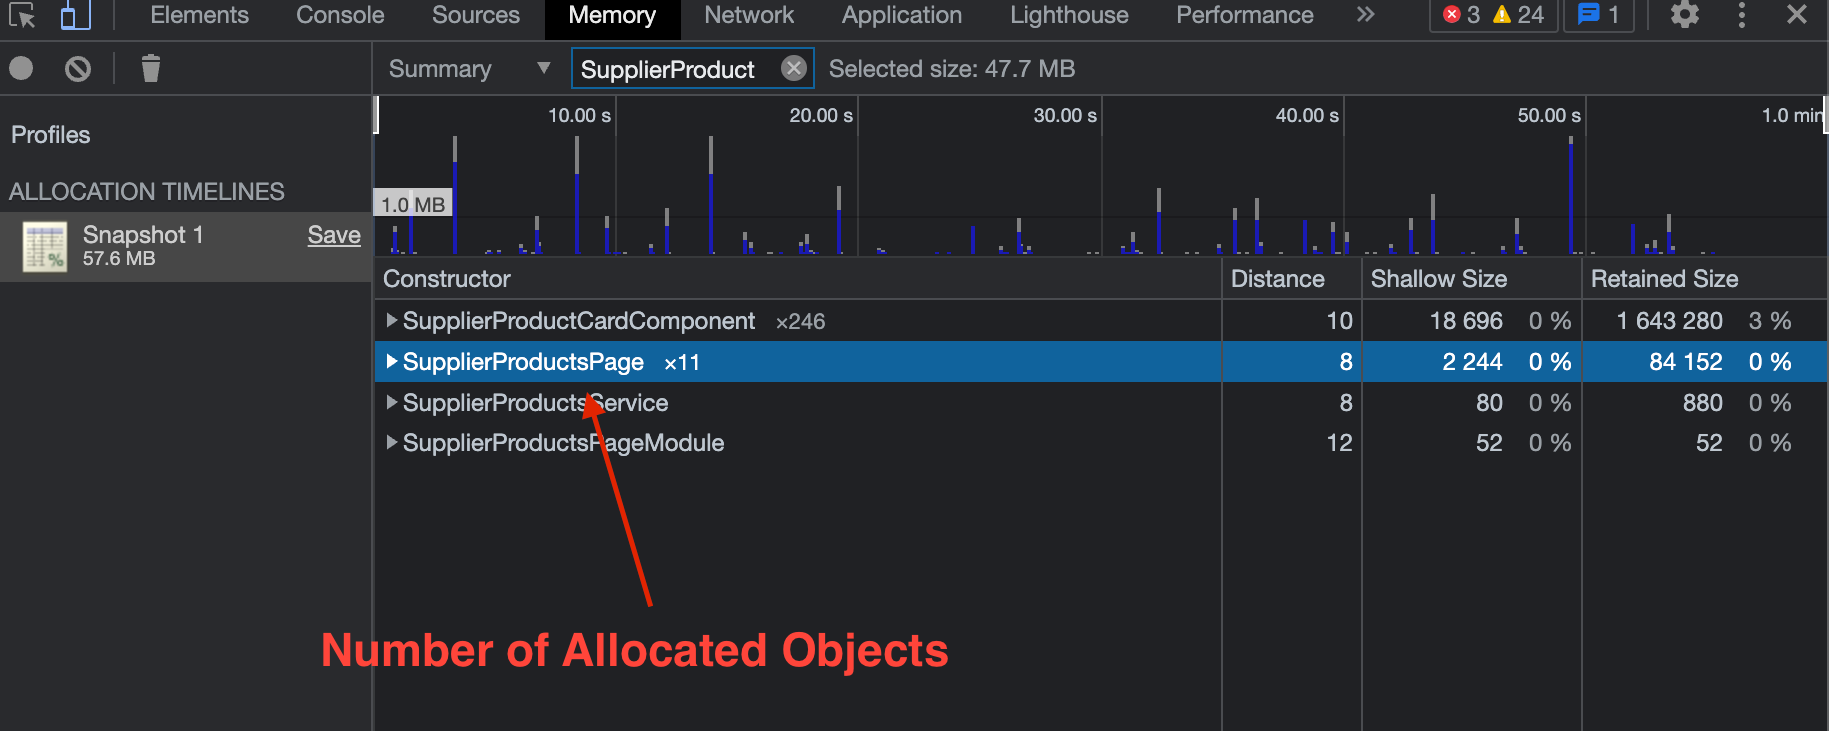
After visiting multiple supplier products pages, I found that none of the visited pages are garbage collected (see the figure below). This means that there are some references to those objects which prevents the GC from collecting the allocated memory.
We can see that the retained size (i.e: the amount of memory that will be free once the object is garbage collected) for SupplierProductsPage and SupplierProductCardComponent which is the product cards inside the page are almost 1.72MB.
We can also see that the heap size jumped from 19.5MB to 57.6MB (38.1MB up, almost a 200% increase).
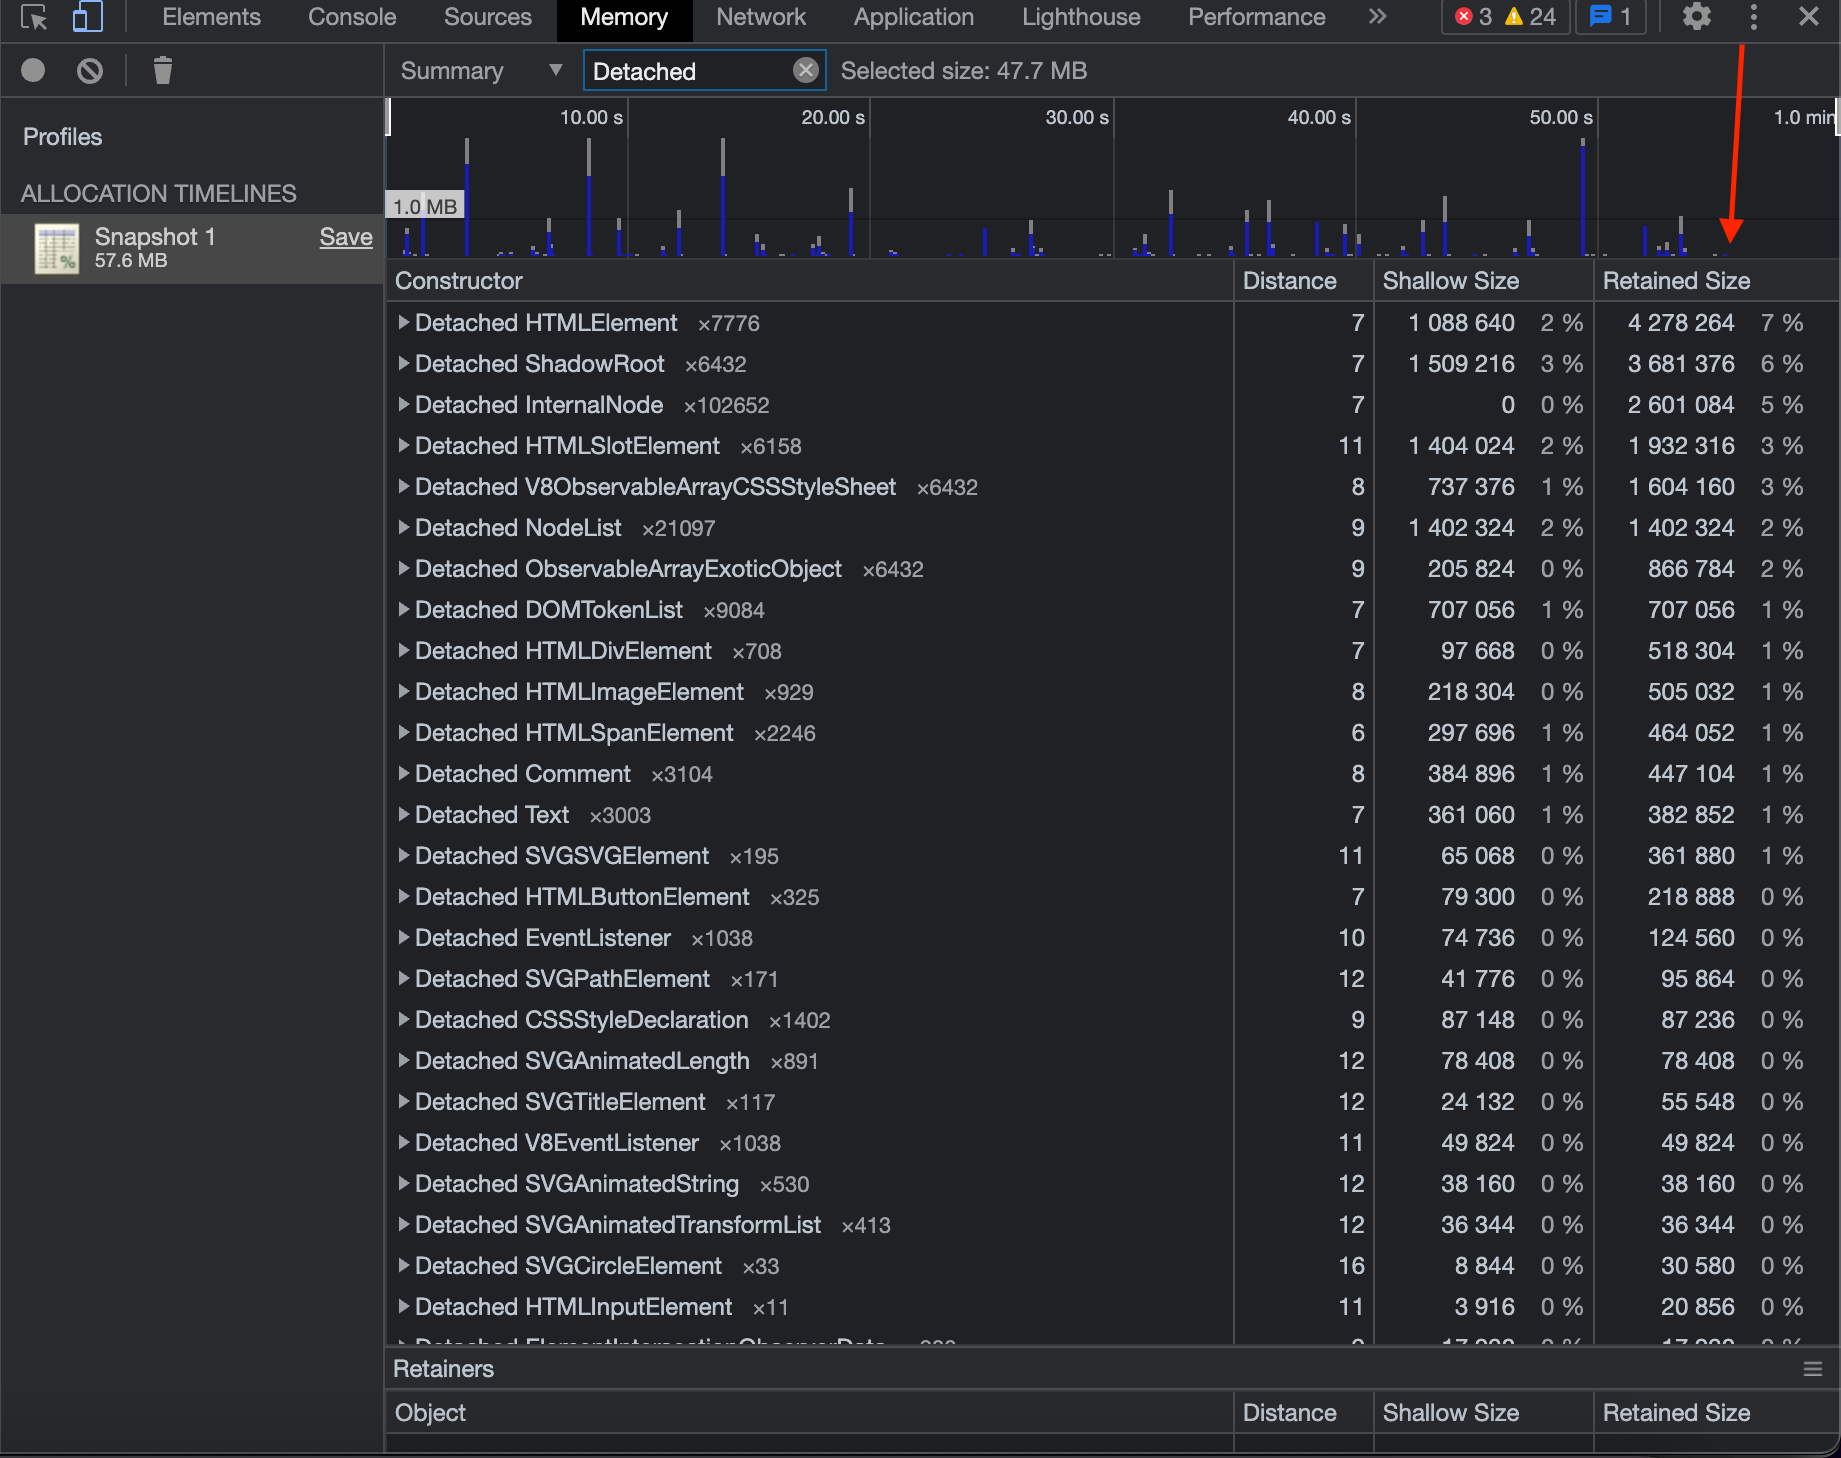
Objects taking a significant size and bloating the memory are detached elements, which are elements removed from the DOM tree but are still referenced somewhere so they don’t get garbage collected.
We can see in the figure below by checking the retained size column for each detached element group that the retained size by each group is huge.
Performance Monitor
The performance monitor gives you a real-time view of various aspects of run-time performance, it gives you graphs showing the total number of DOM nodes created, JS Heap size, and more.
Recording the DOM nodes creation and JS heap size while visiting multiple suppliers indicates that the total number of nodes created and JS heap size graphs are taking the shape of a ladder which means that they keep growing only, almost taking the shape of a straight line going up.

Retainer Tree
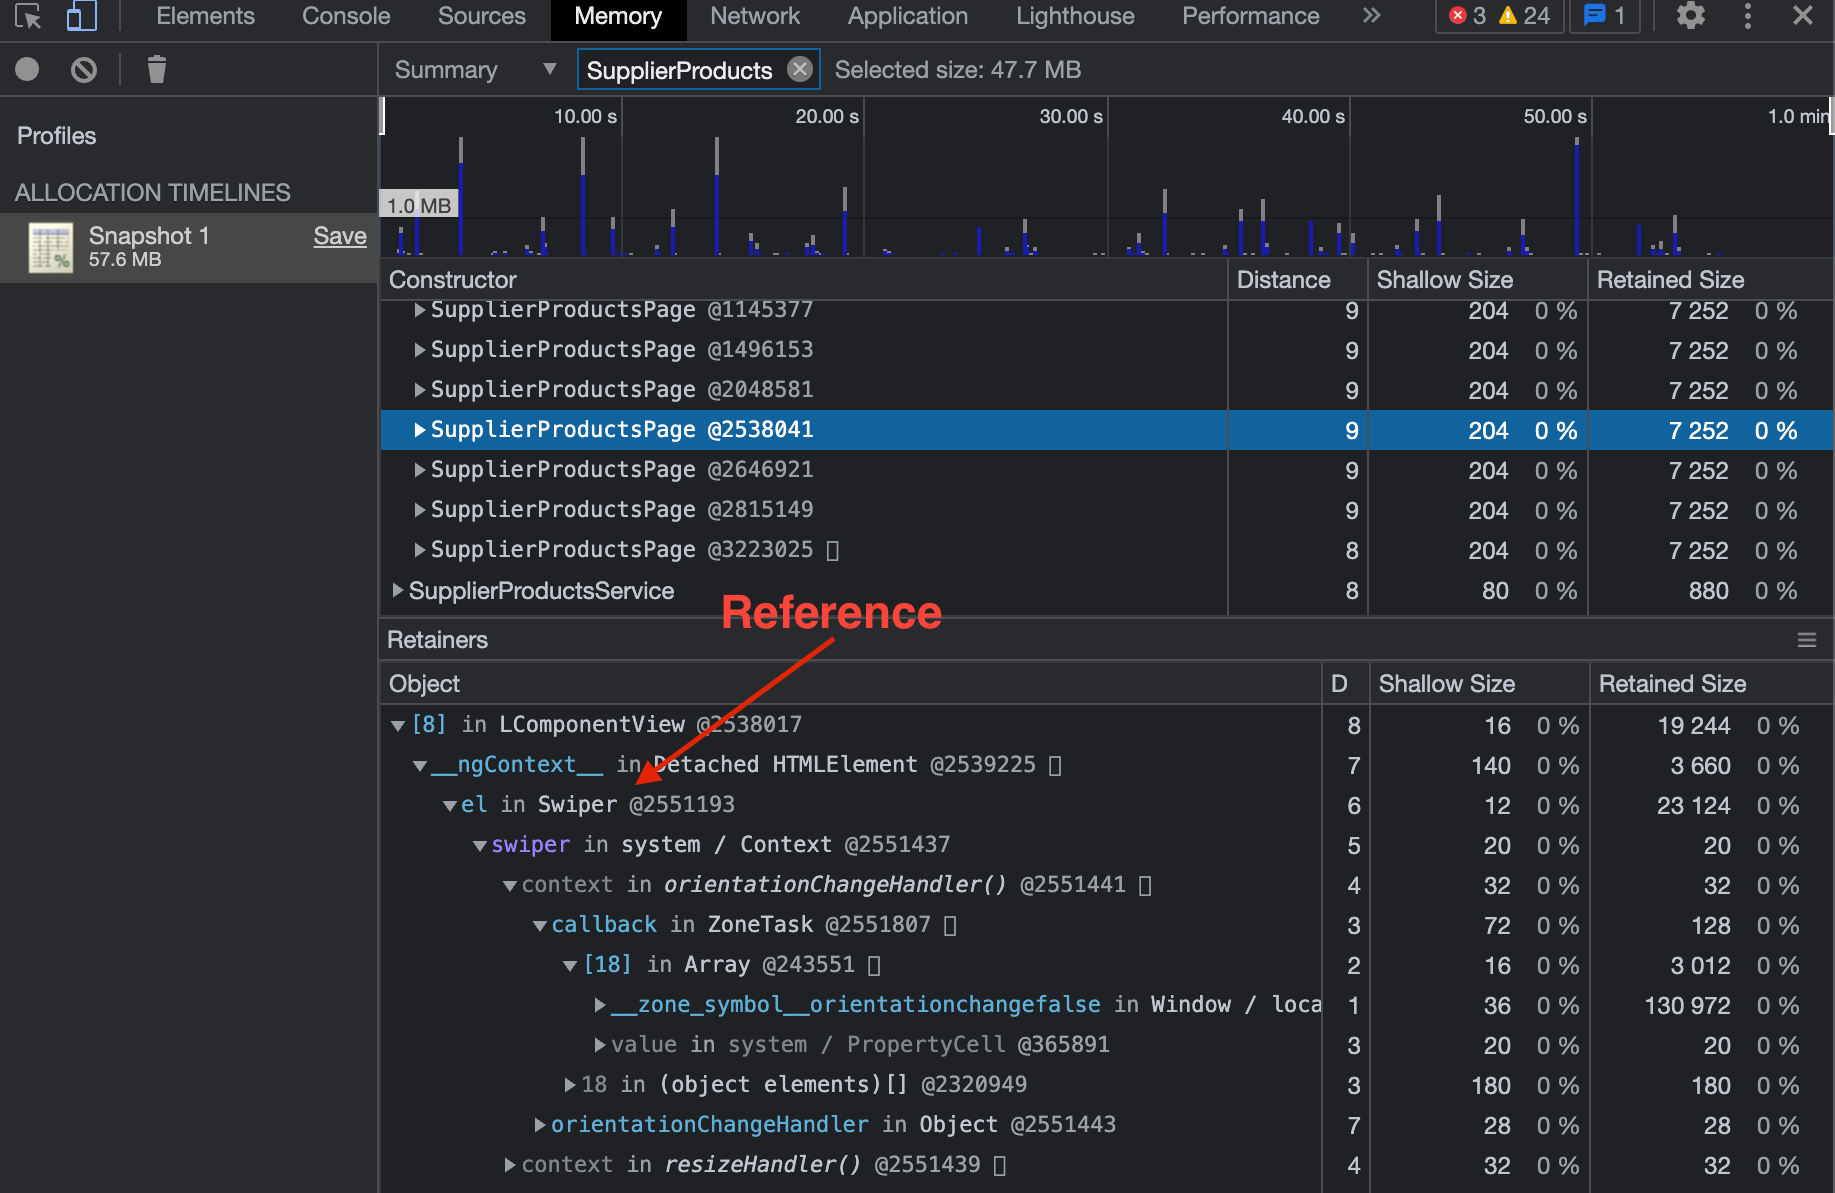
Retainer Tree represents the objects that have reference to the selected object.
Checking the retainer tree for each of the SupplierProductsPage objects indicates there’s a common reference between them which is el in Swiper which is a Detached HTMElement.
Swiper comes from ion-slides which is an ionic element and internally works using SwiperJS.
Digging into ion-slides
Doing some search about ion-slides, I found out that it has been deprecated and Ionic suggests migrating to SwiperJS and using it directly for Angular [2].
By checking the retainer tree for the swiper element, it turns out there is an event listener that is still alive which holds a reference to the element.
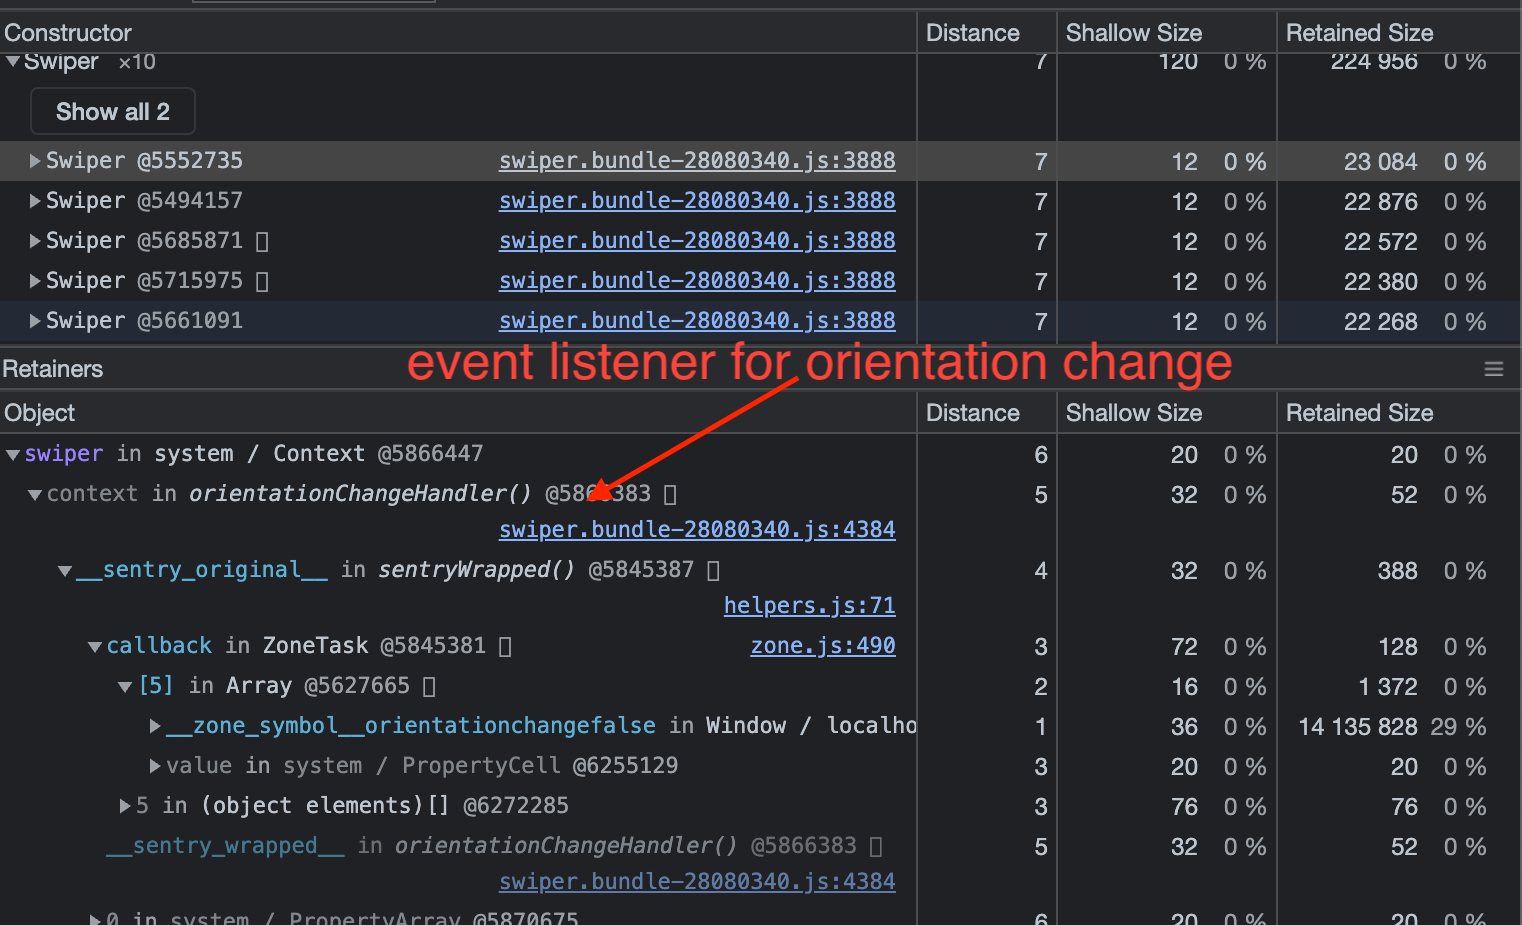
swiper elementDigging into the code for swiper in @ionic/core, I found two event listeners; one on orientationChange, and the other on window resize in order to resize the swiper element in both cases.
The problem was that the destroy method was never invoked to remove the listeners, as I tried adding two console.log one in init method and the other in destroy method and fount that destroy was not invoked on leaving the page, and that was causing a memory leak [3].
var Resize = {
  name: 'resize',
  create() {
   // some logic
  },
  on: {
    init() {
      const swiper = this;
      // Emit resize
      win.addEventListener('resize', swiper.resize.resizeHandler);

      // Emit orientationchange
      win.addEventListener('orientationchange', swiper.resize.orientationChangeHandler);
    },
    destroy() {
      const swiper = this;
      win.removeEventListener('resize', swiper.resize.resizeHandler);
      win.removeEventListener('orientationchange', swiper.resize.orientationChangeHandler);
    },
  },
};
ion-slidesBy commenting the line for adding the two event listeners and retry the same scenario found that there were no memory leaks.
Solution
The solution to migrate to SwiperJS as advised and install the latest version because @ionic/core was using v5.4.1, released on May 2020, and is so outdated.
Adding console.log inside destroy method of resize.js file in the newer SwiperJS, I found that the destroy method was invoked and the event listeners were removed and no memory leaks occurred[4].

Results
Before starting recording the heap size was 18.9MB.
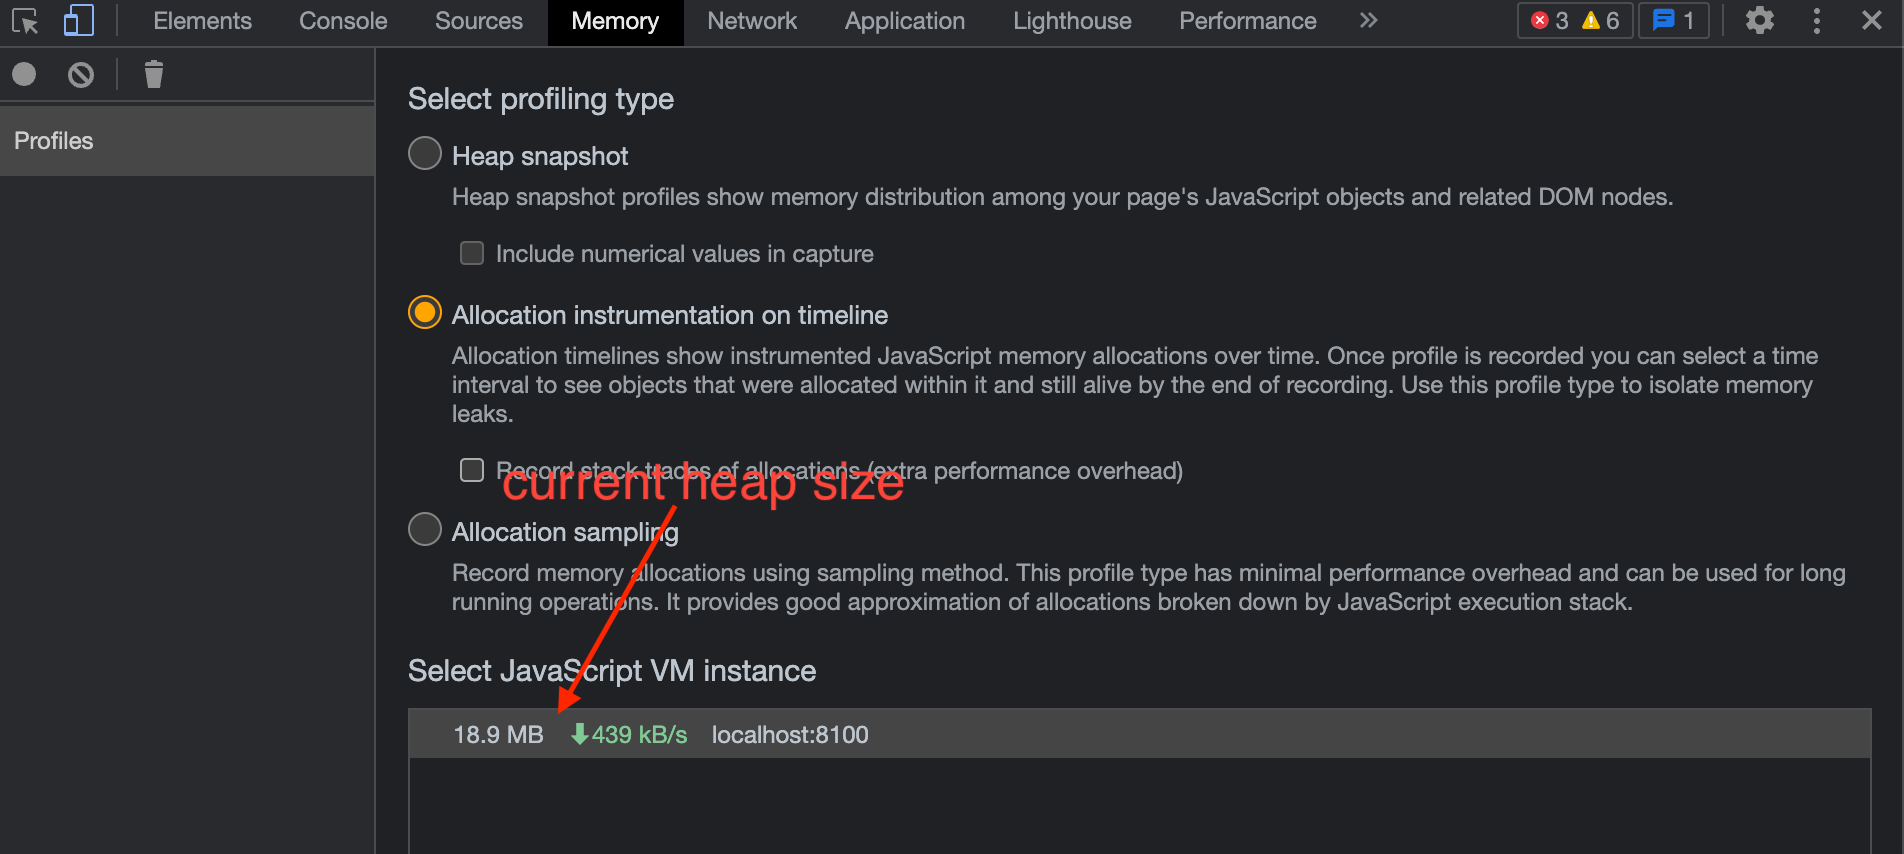
After migrating to SwiperJS and visiting the same number of suppliers while recording the heap allocation timeline, all the objects were garbage collected and there was no trace for SupplierProductsPage or SupplierProductCardComponent objects.
We can see that the heap size is 23.1MB (4.2MB increase).

We can also see that there are no traces of the huge amount of detached elements.

Also by checking the performance monitor for DOM Nodes and JS Heap size we can see that the timeline is taking the shape of the healthy saw tooth wave which indicates that memory gets allocated and then deallocated.
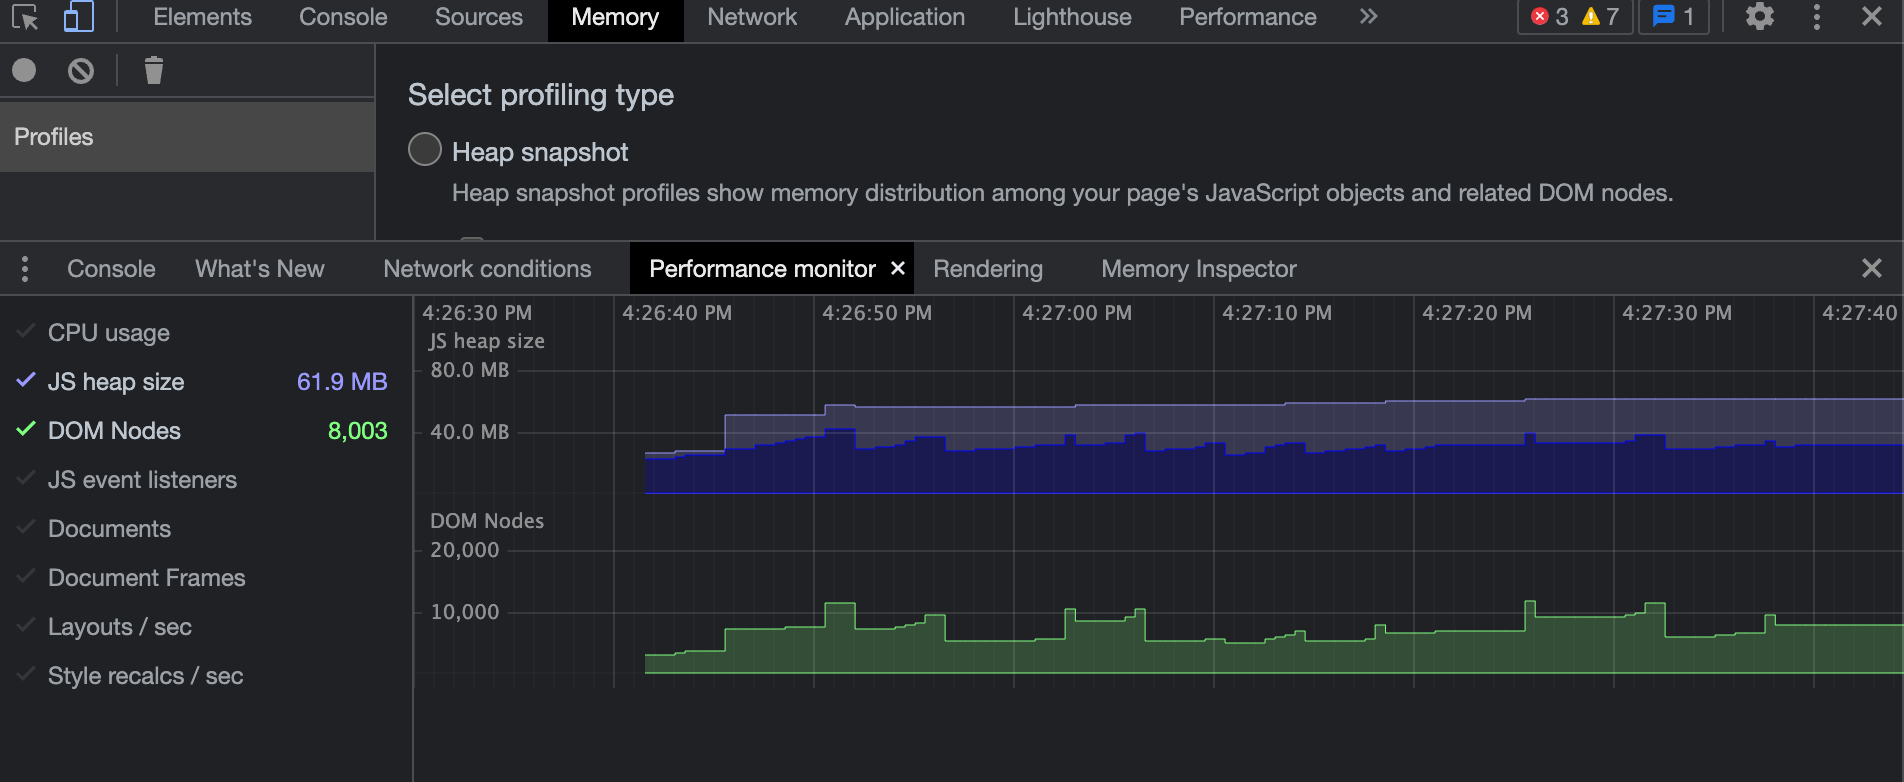
Compare that to the corresponding chart prior to the fix and you can see a 400% improvement in Dom nodes count, and a much healthier JS heap size chart!

Conclusions
- Checking for memory leaks should be done on a regular basis because any new change, even if not by your engineers, can cause memory leaks..
- You should always keep up to date with the recommendations of the tools and frameworks you’re using.
- Event listeners should always be removed once not needed to avoid memory leaks [5].
References
- [1]: https://developer.chrome.com/docs/devtools/memory-problems/#overview
- [2]: https://ionicframework.com/docs/api/slides#migration
- [3]: https://github.com/ionic-team/ionic-framework/blob/7e5c03ae4096ada8bc7388975a83e51aab55cce5/core/src/components/slides/swiper/swiper.bundle.js#L4376
- [4]:https://github.com/nolimits4web/swiper/blob/0567641fbe4bdbea54b5de0bcc2c937dfb52e088/src/core/modules/resize/resize.js#L62
- [5]: https://www.ditdot.hr/en/causes-of-memory-leaks-in-javascript-and-how-to-avoid-them#event-listeners

