Solving Memory Leaks Issues in Ionic Angular

Introduction
In this article, we will walk you through how to detect memory leaks in your web application and how to investigate the reasons behind those memory leaks and solve them using a real-world example. We will have a journey together to get from snapshot 1 to snapshot 2.
Note: In this article, we are using Ionic v5 and Angular v9.1.12.

Memory leaks are one of the most challenging optimization issues to tackle, they can have multiple sources and usually, you will need to find the pattern that causes a memory leak. That's why it's crucial to learn how to measure memory performance and get insights from memory allocation timelines.
What Is A Memory Leak?
In computer science, a memory leak is a type of resource leak that occurs when a computer program incorrectly manages memory allocations in a way that memory that is no longer needed is not released 1. In short, a memory leak can be defined as some memory allocated that is not required anymore but not released, i.e, not garbage collected.
Most modern programming languages manage memory automatically. The memory lifecycle usually consists of three steps:
1. Allocate memory needed
2. Read from and write to allocated memory
3. Release the memory allocated as soon as it's not needed anymore
Angular does a great job at memory management but in some cases that results from bad practices in implementation leads to memory leaks and that has a very bad impact on the user experience.
Debugging Process
Because the performance of our application degrades with time throughout the user session this is a strong indication of the existence of some memory leaks. To study that we needed to monitor the memory use in real time.
Step 1: Monitor Memory Allocation In Real-Time
Chrome DevTools has two very helpful memory debugging tools for monitor memory allocation in real-time:
1. Performance Monitor
2. Record Memory Allocation Timeline Heap Snapshot
Let's start with the performance monitor.
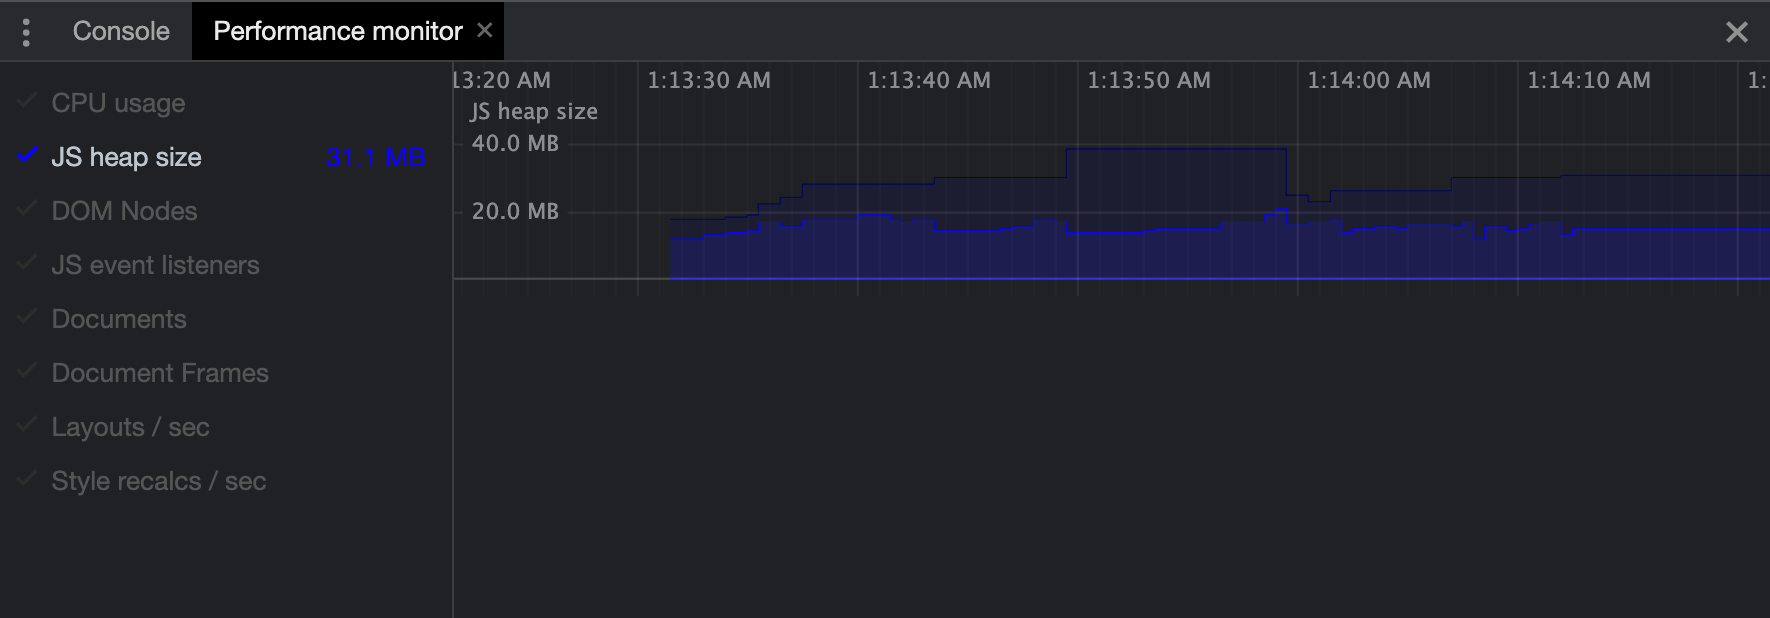
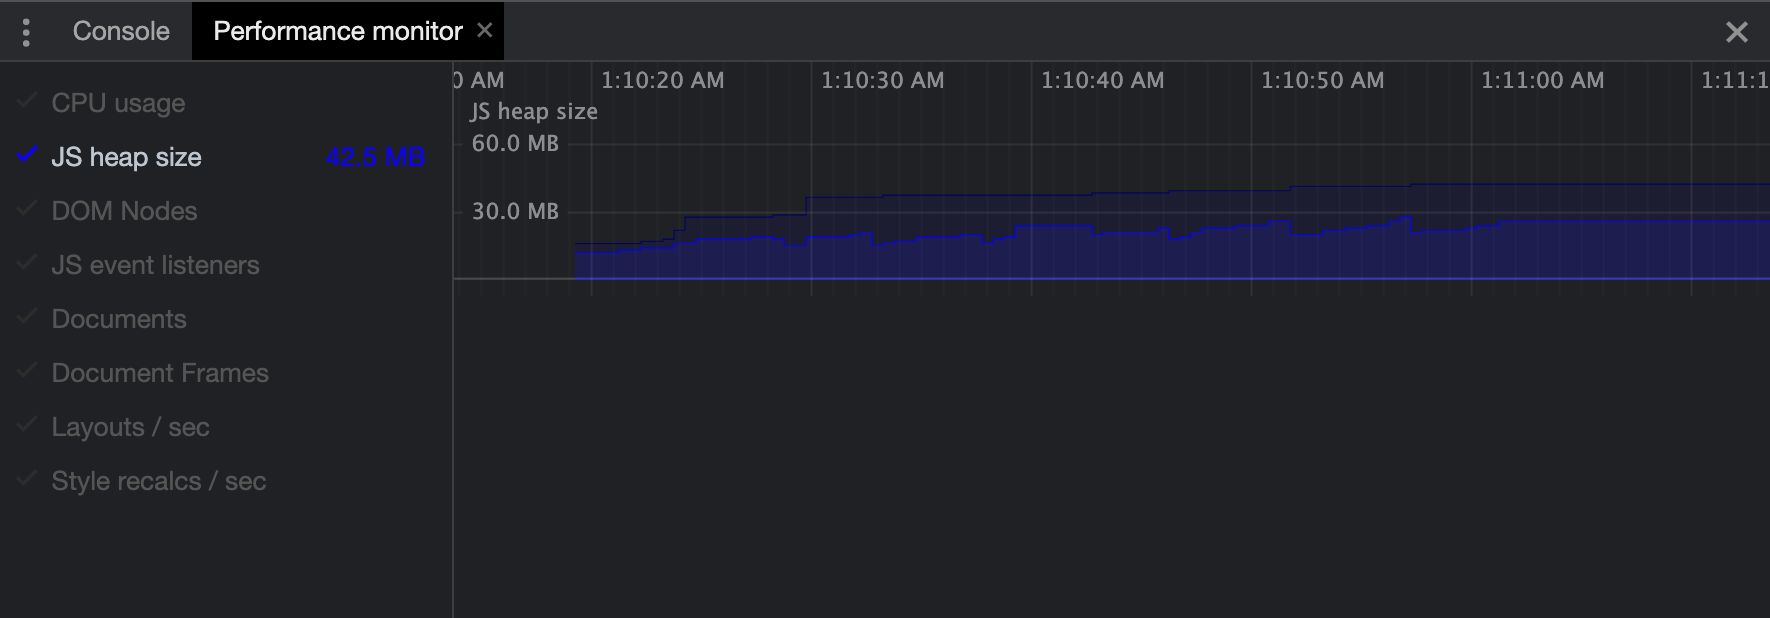
Performance monitor
If we open the performance monitor it starts recording the heap size throughout the session. We can see in the graph below that it has the shape of a sawtooth, the heap size is getting bigger over time and that indicates that there are some memory allocations that have not been garbage collected.
Now we need to get our hands on the objects that are not garbage collected. To find that we will take a memory allocation timeline heap snapshot
Recording Memory Allocation Timeline Heap Snapshot
To record a memory allocation timeline make sure to refresh the page and click on the collect garbage icon, to clean the memory from any previous session leftover objects.
Note: in an Angular web application make sure to set the optimization flag in angular.json file to false in order to be able to search for the components by their names.
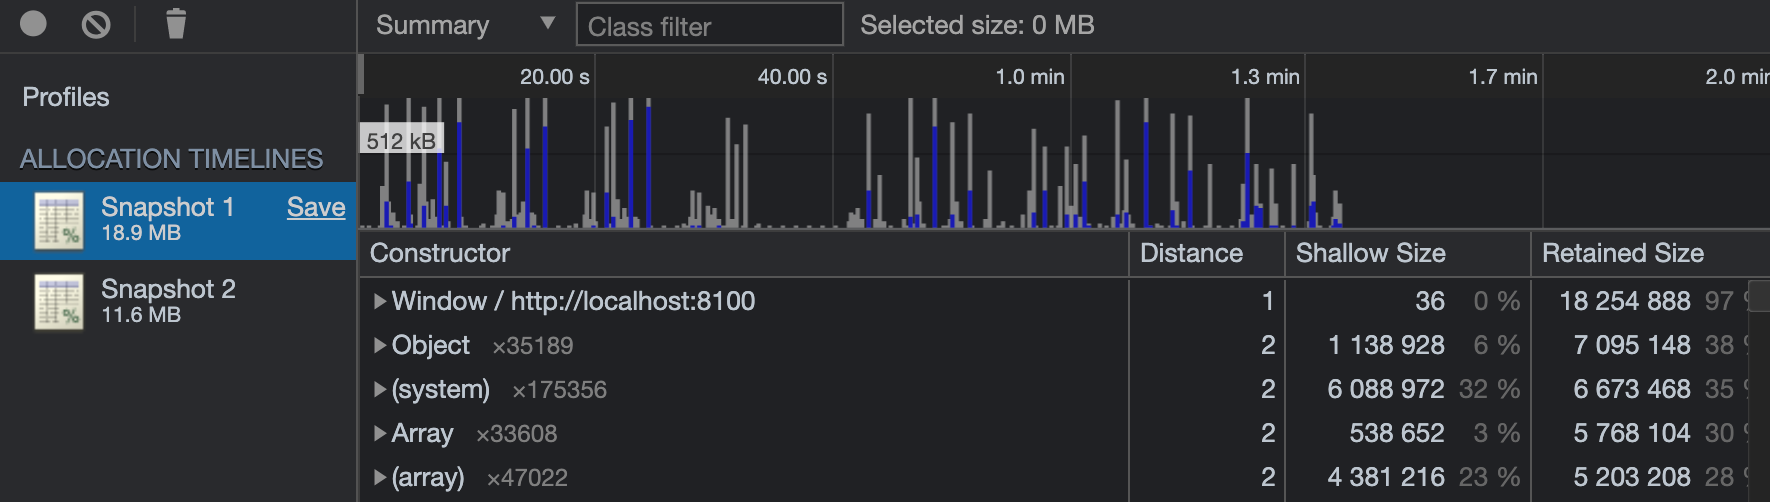
In the memory allocation timeline below those blue bars represent new memory allocations, and grey bars represent garbage-collected memory. We can see that on each store's page we enter that memory gets allocated but when we leave the page the memory is not freed and that means we have some memory leaks.
Before we dive into finding the reason for the memory leaks, let's talk briefly about how garbage collection works in JavaScript. In Javascript, resources get garbage collected when there are no references to it. That means that even if an object is not needed anymore but still referenced and accessible from another place in our application, it will not be garbage collected. This issue can't be handled by the garbage collector, it's up to the developer to clean up the references to the objects.
Step 2: Investigating The Reasons For Memory Leaks
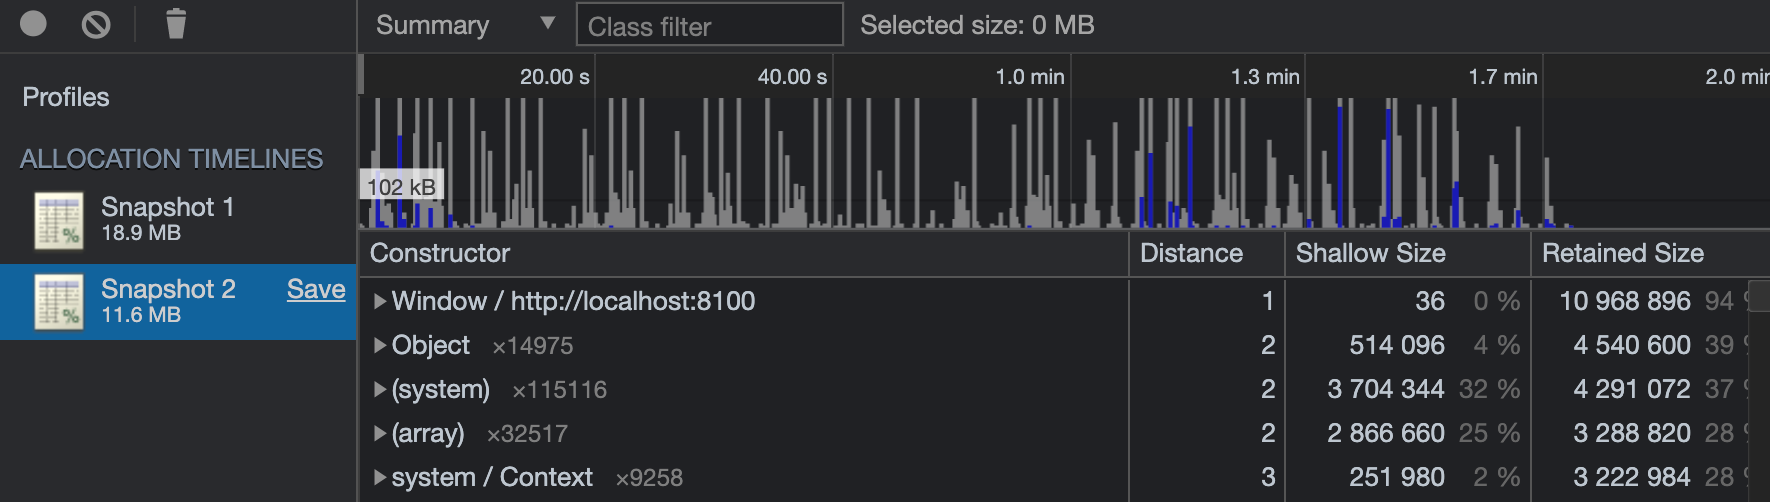
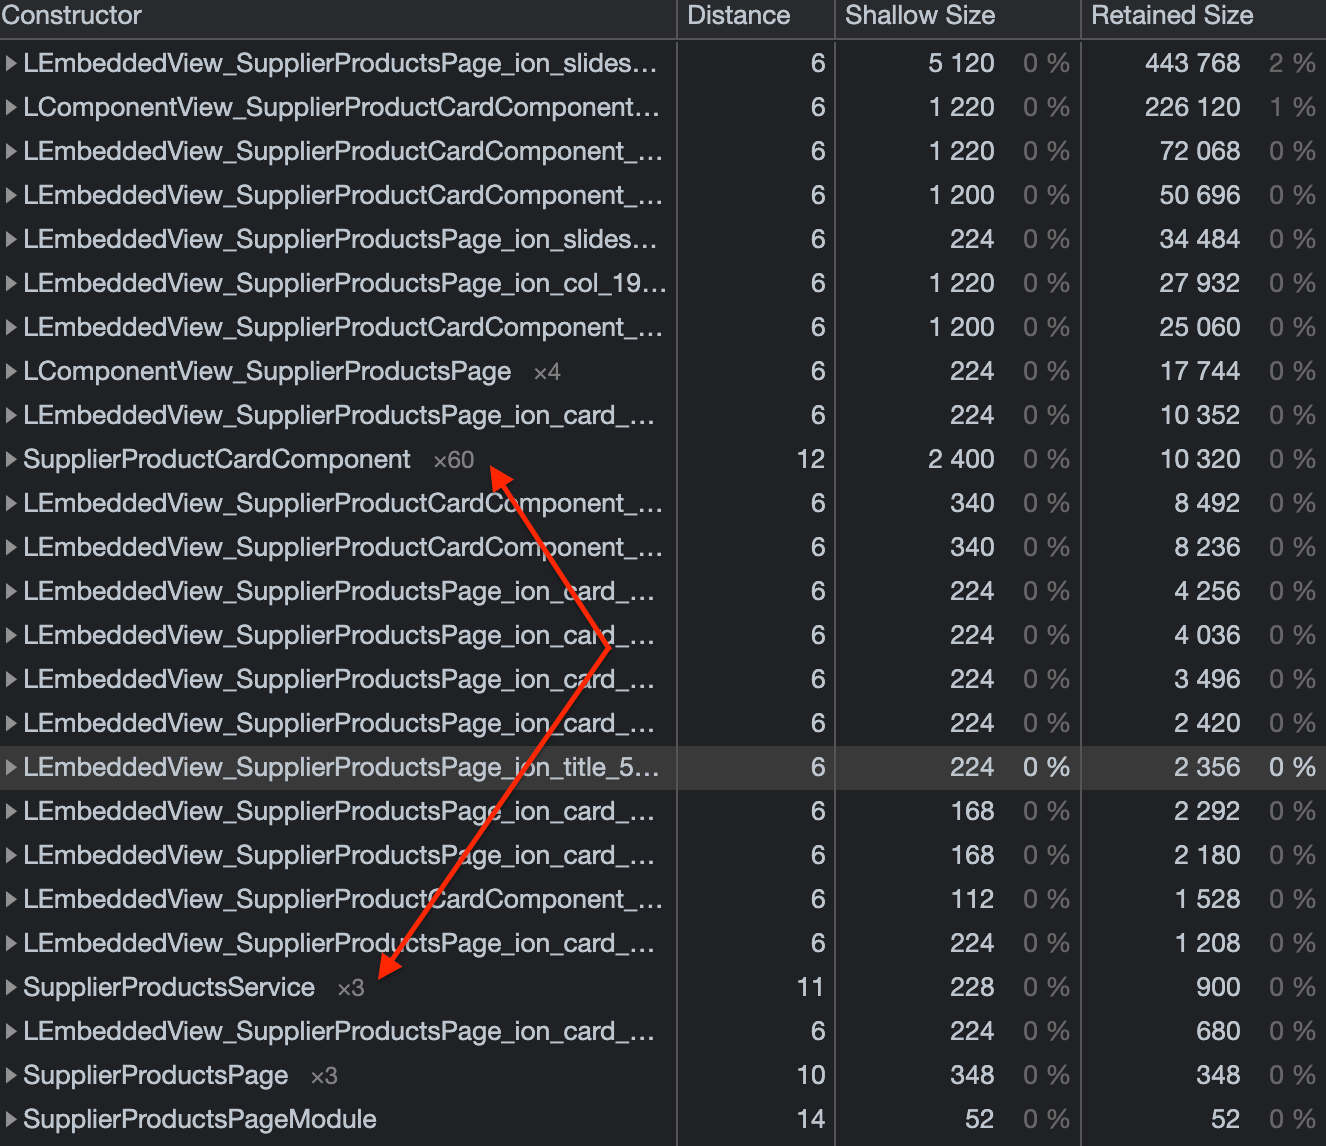
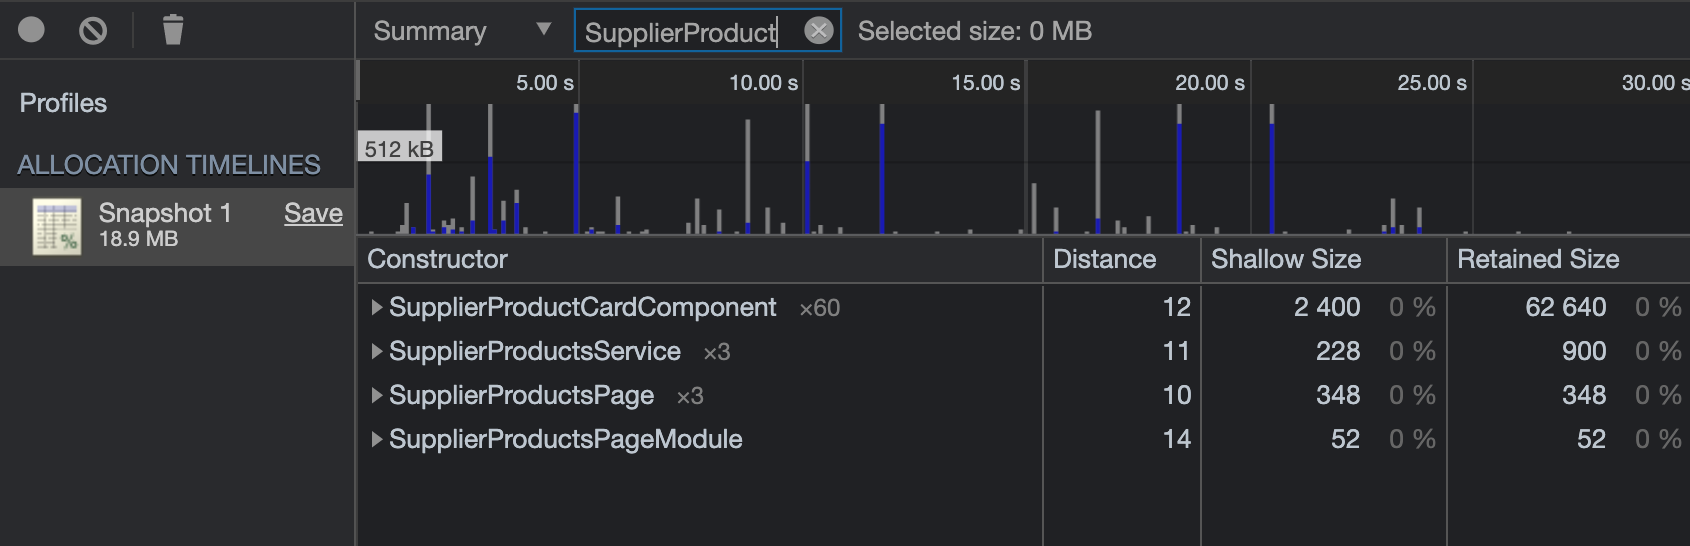
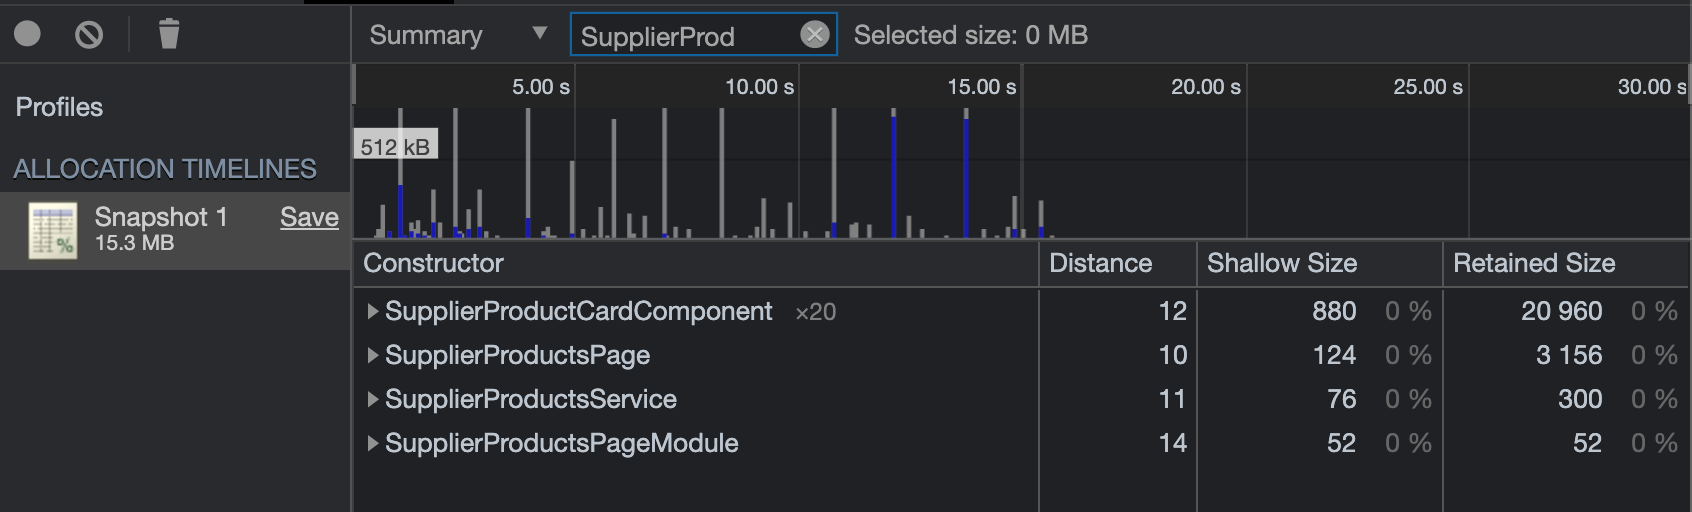
After stopping the recording and you click on an object you can filter the objects by their names. On this page, we have two components SupplierProductsPage and SupplierProductCard which are rendered inside the former page as a child component.
If we filter the objects by name we will find that we have 3x SupplierProductsPage objects and 60x SupplierProductCard objects as we show 20x products on entering the page. Also, we can see some other objects created by Angular Ivy which have a very large Retained Size -- i.e the size of memory that is freed once the object itself is deleted along with its dependent objects that were made unreachable from GC roots.
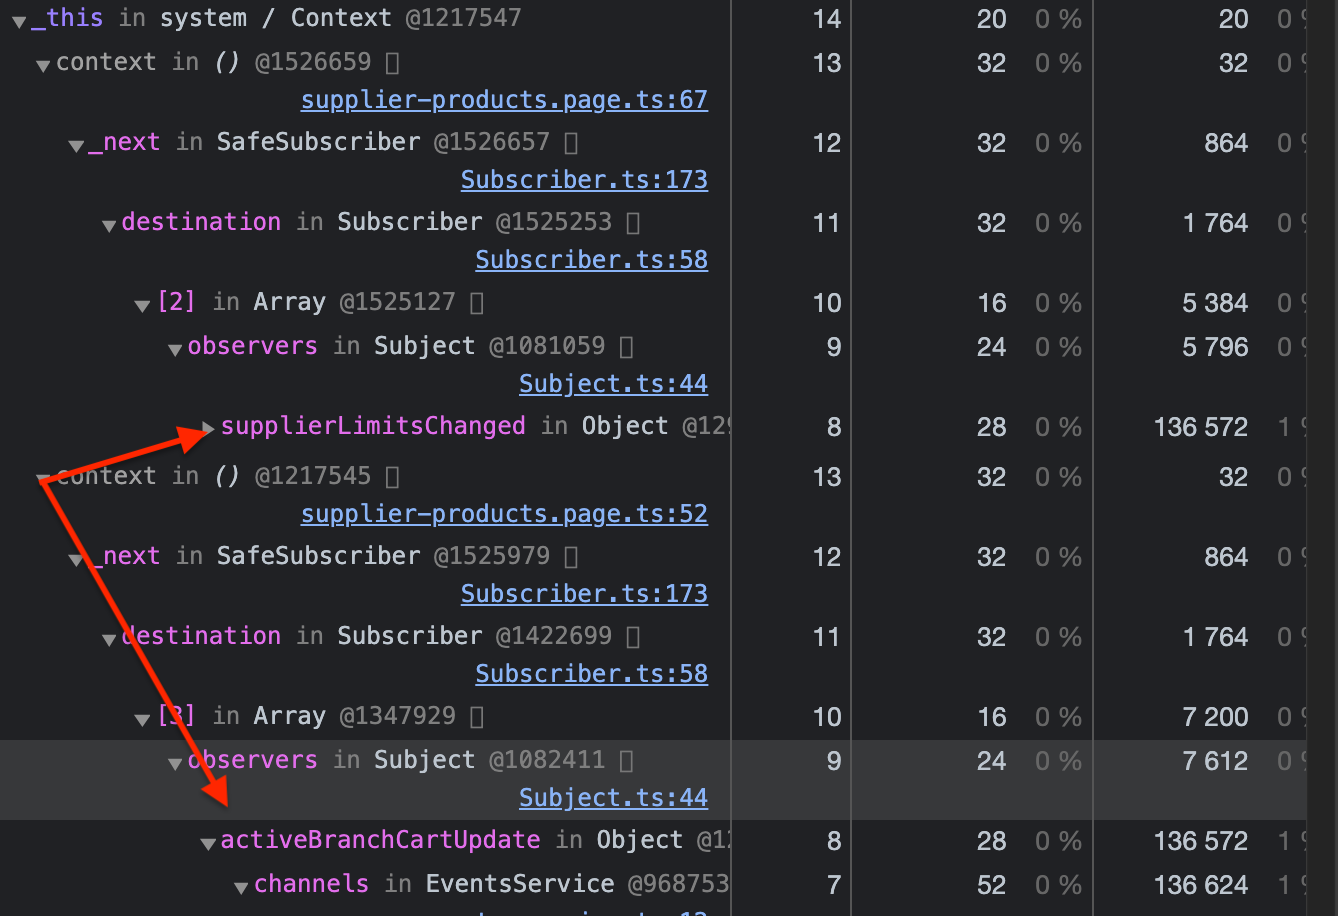
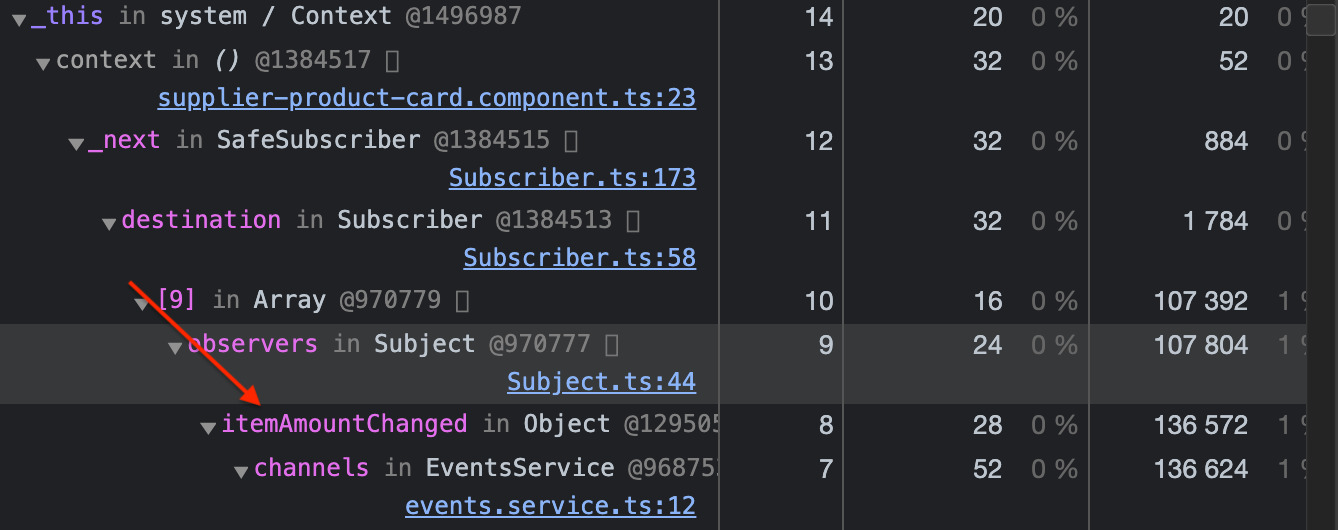
If you click on an object you will find a window get shown called object's retaining tree. This tree shows us the objects that have reference to the selected object. After going through the object's retaining tree of SupplierProductsPage object and SupplierProductCard object we found that there are subscriptions to RxJS Observables that are still alive and causing the memory leaks.
RxJS is a library for composing asynchronous and event-based programs by using observable sequences. It combines the Observer pattern with the Iterator pattern and functional programming with collections to fill the need for an ideal way of managing sequences of events 2.
In RxJS it is very important to remember to unsubscribe from an observable for two reasons:
1. A subscription has a reference to the component they are created in. So, when the component gets destroyed it will not be garbage collected and that will result in a memory leak.
2. The code will continue to execute in the background even if the component gets destroyed, and that can result in unpredictable errors and side effects.
The solution to this issue is quite simple yet can go unnoticed very easily. We need to hook into ngOnDestroy component lifecycle to clean up our subscriptions in both components before the component gets destroyed.
Step 3: Applying Solutions
Upgrading To Angular 10
We found that in Angular 9, Ivy is leaking memory and it doesn't deallocate memory of destroyed components correctly. In this issue you can find people complaining about it. So we tried upgrading to Angular 10 to see if this issue is resolved in the newer version and we found that it did get resolved.
In the heap snapshot below we can see that the LEmbeddedView_ and LComponentView_ don't exist anymore.
Result Of Unsubscribing From Observables
The subscriptions have been cleaned up, however, after taking a new record for the memory allocation timeline the object's did not get garbage collected.
To find the reason why the objects didn't get garbage collected event after unsubscribing it took some time because I found that the problem was not in our implementation but it's a bug in an Ionic component which is ion-img, this component lazily loads images.
Describing The Bug In ion-img Component
We came across this issue, in the comments we found that someone has reported that ion-img component implemented by Ionic didn't clean up its IntersectionObserver references properly. If you checkout the code for the implementation, you will find that the IntersectionObserver doesn't get disconnected on the component destroy.
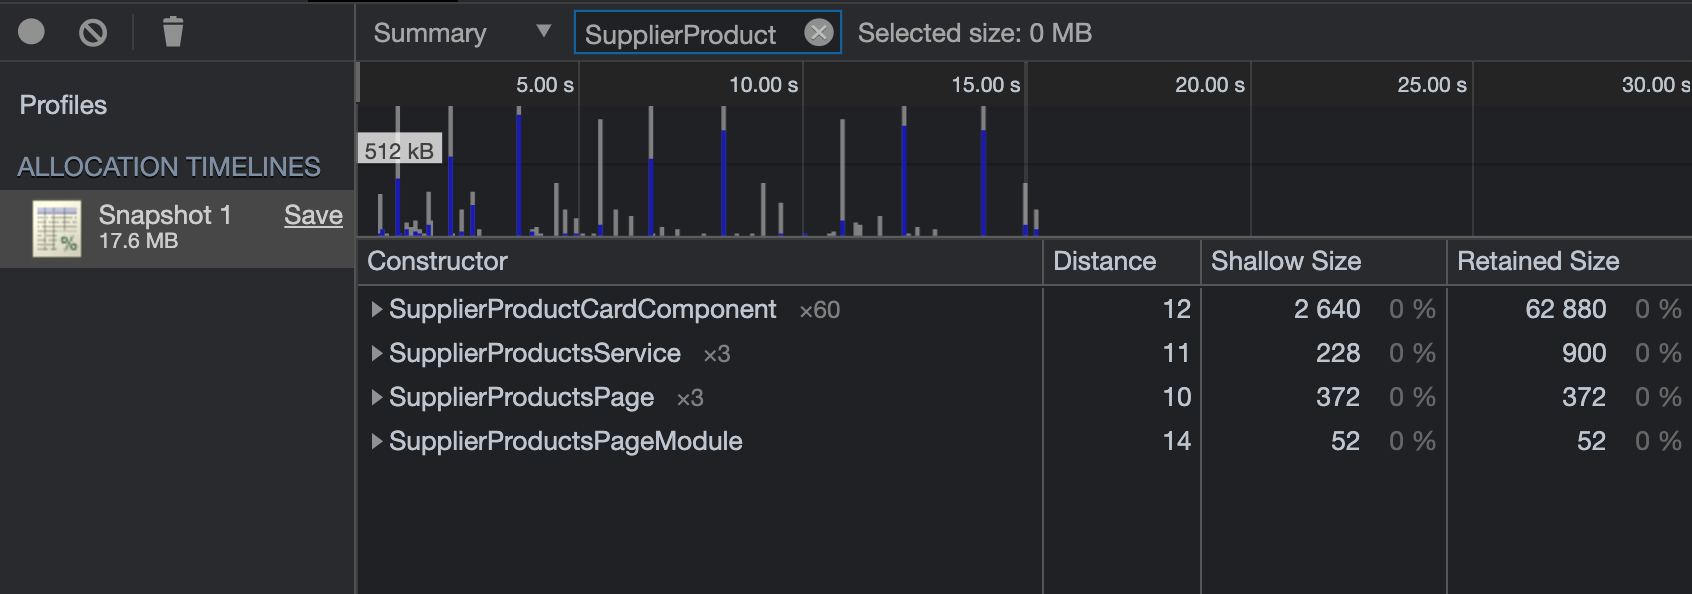
To confirm that we tried to use a native img tag and see if the components are garbage collected. We recorded a new memory allocation timeline to check the number of objects for each component.
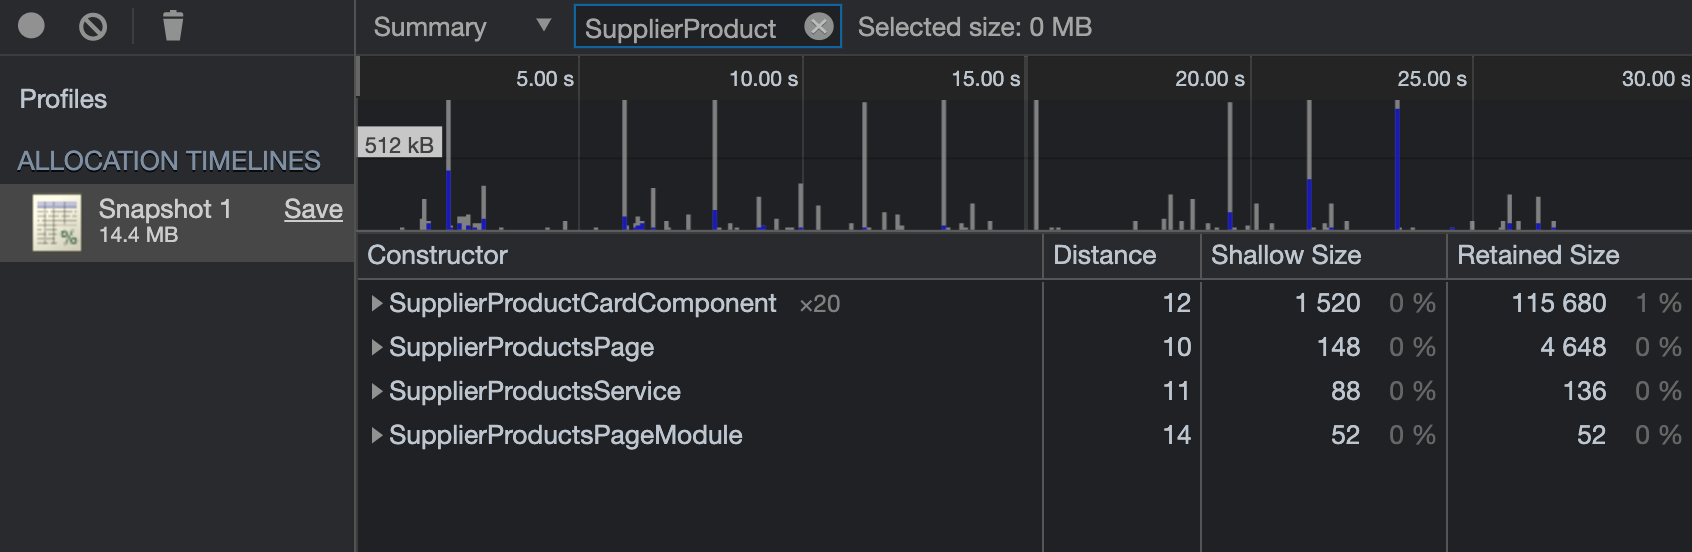
In the recording below, we can see that each time we visit a store's page the garbage collector runs and the previous memory allocations get garbage collected, and that proves that the component is the problem.
We can see here that the number of SupplierProductsPage object is only x1 and the number of SupplierProductCard object is only x20 which is the number of product cards we render on entering the page.
Surprisingly, when we tried to use loading="lazy" attribute on the native img tag, the issue still persists and the components don't get garbage collected 3.
Implementing Lazy Loading
Since we can't eagerly load images on all pages to avoid performance issues, we decided to implement lazy loading ourselves to make sure we disconnect from the IntersectionObserver on component destroy.
To avoid reinventing the wheel, we tried to look if someone has created a directive for images lazy loading and we came across this amazing implementation by Ben Nadel. The implementation needed to get updated because it was implemented for Angular 5 and we use Angular 10.
After Implementing lazy loading as a directive added it to the native img tag using IntersectionObserverAPI we had the same result as using the native img tag, and that's because we made sure in the implementation that we disconnect from the IntersectionObserver when the component gets destroyed.
Results
After applying the above solutions:
- Upgrading to Angular 10
- Unsubscribing from observables on components destroy
- Removing
ion-imgcomponent from all components and implement lazy loading
To compare the heap snapshots we tried to perform the same actions on each session, we found that the heap size in production mode has decreased significantly from 18.9mb to 11.6mb. Also, we can see that the performance monitor graph has improved and it shows that there are multiple drops in heap size throughout the sessions.