Eliminating N+1 Queries in Your Rails Application

Introduction
Our APIs were suffering from slow response time and this was affecting the user experience on our apps. One of those is an important API which is responsible for fetching products on sale. The problem was resulting from N+1 queries. In this post, we’ll explain what N+1 queries are, how to detect them in your rails application and how to debug in order to eliminate them.
What is N+1 Query
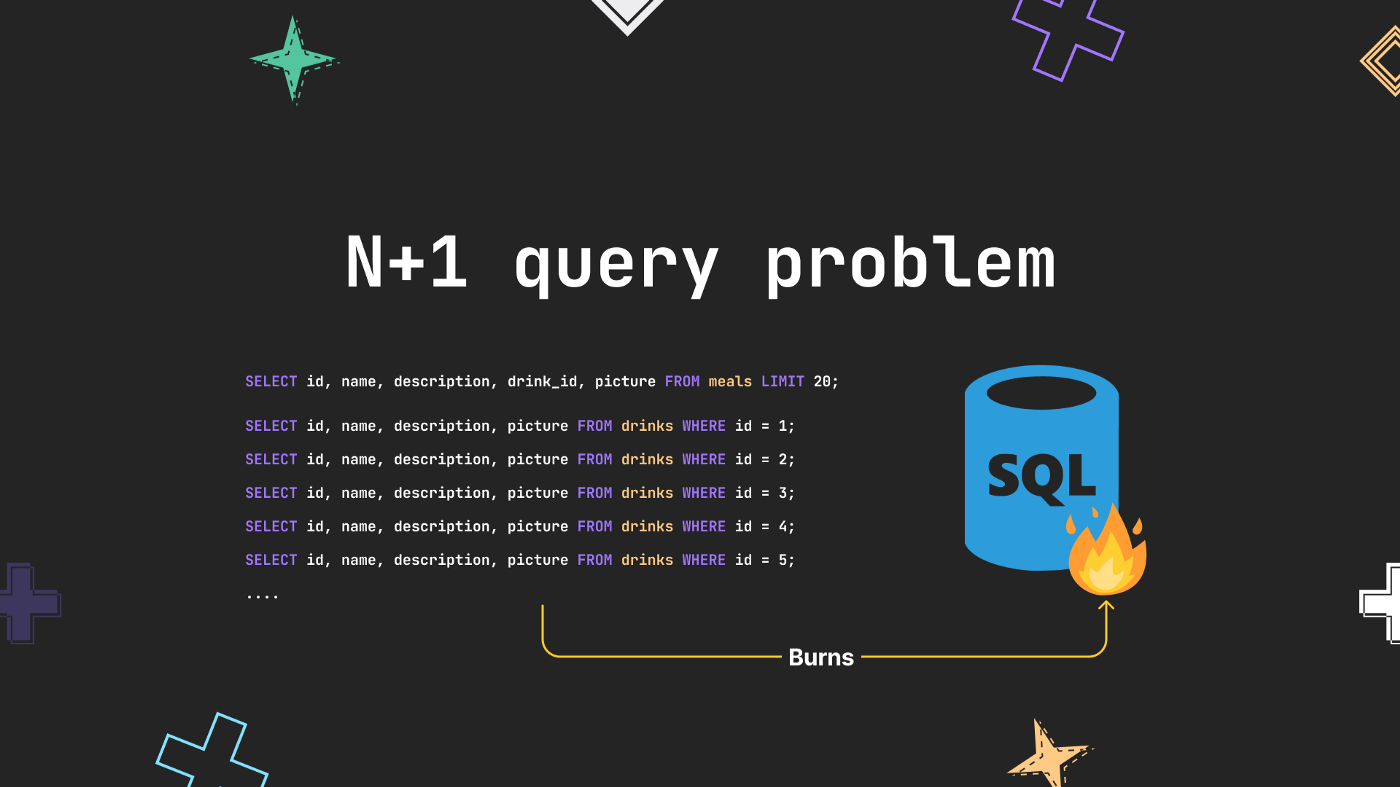
The N+1 query problem is one of the common performance anti-patterns which happens when the data access layer executes N additional SQL statements to fetch the same data that could have been retrieved when executing the primary SQL query [1].
API Performance Before Fix
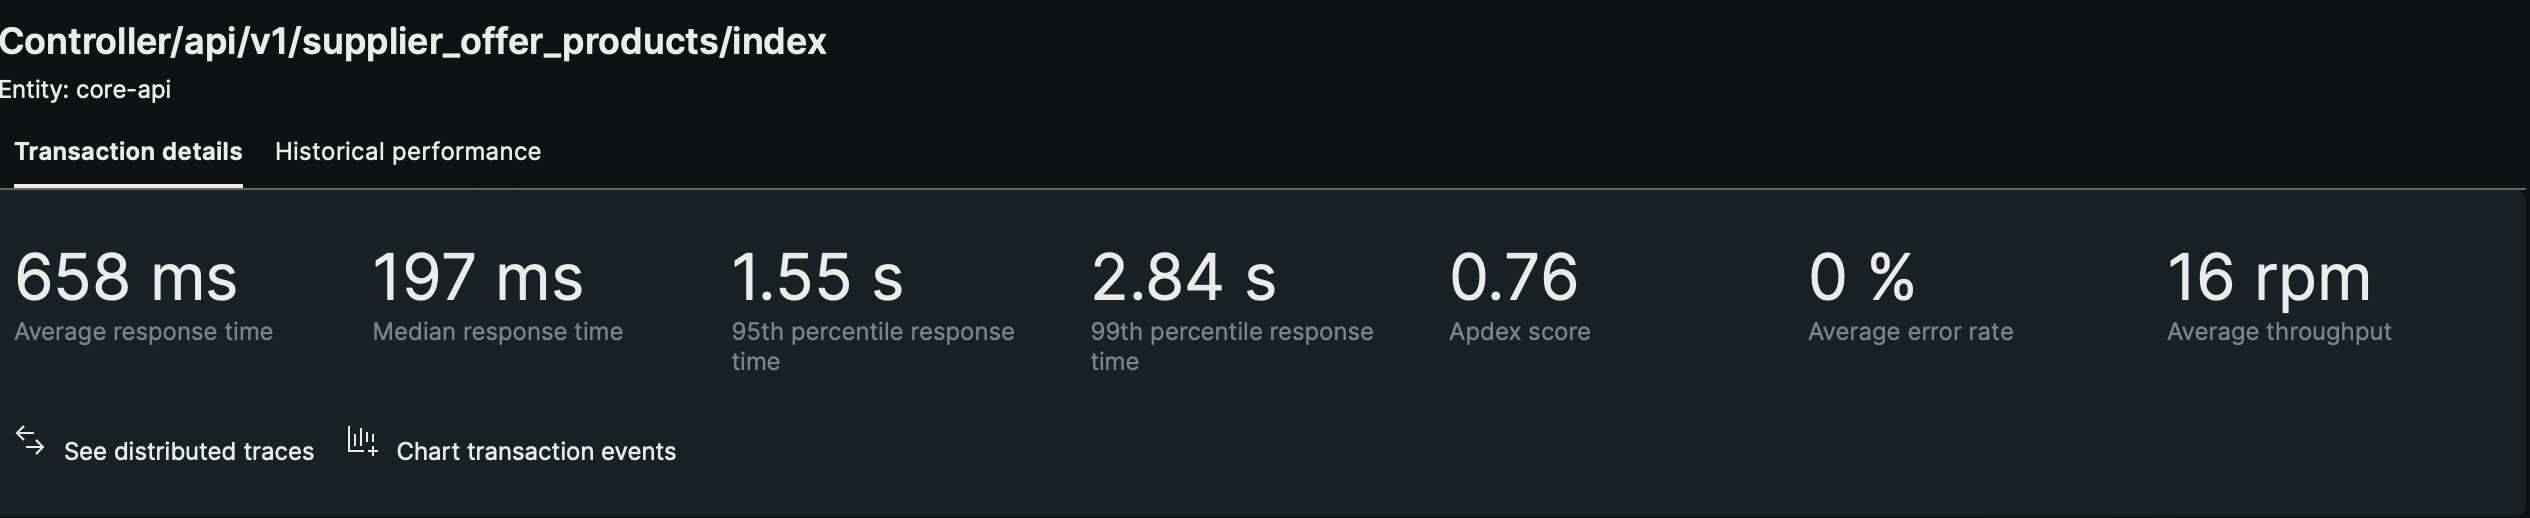
We can see that the API in the screenshot below is suffering a lot, as reported by NewRelic, a performance monitoring tool, with very slow average response time and a low Apdex score (i.e: a ratio value of the number of satisfied and tolerating requests to the total requests made) [2].

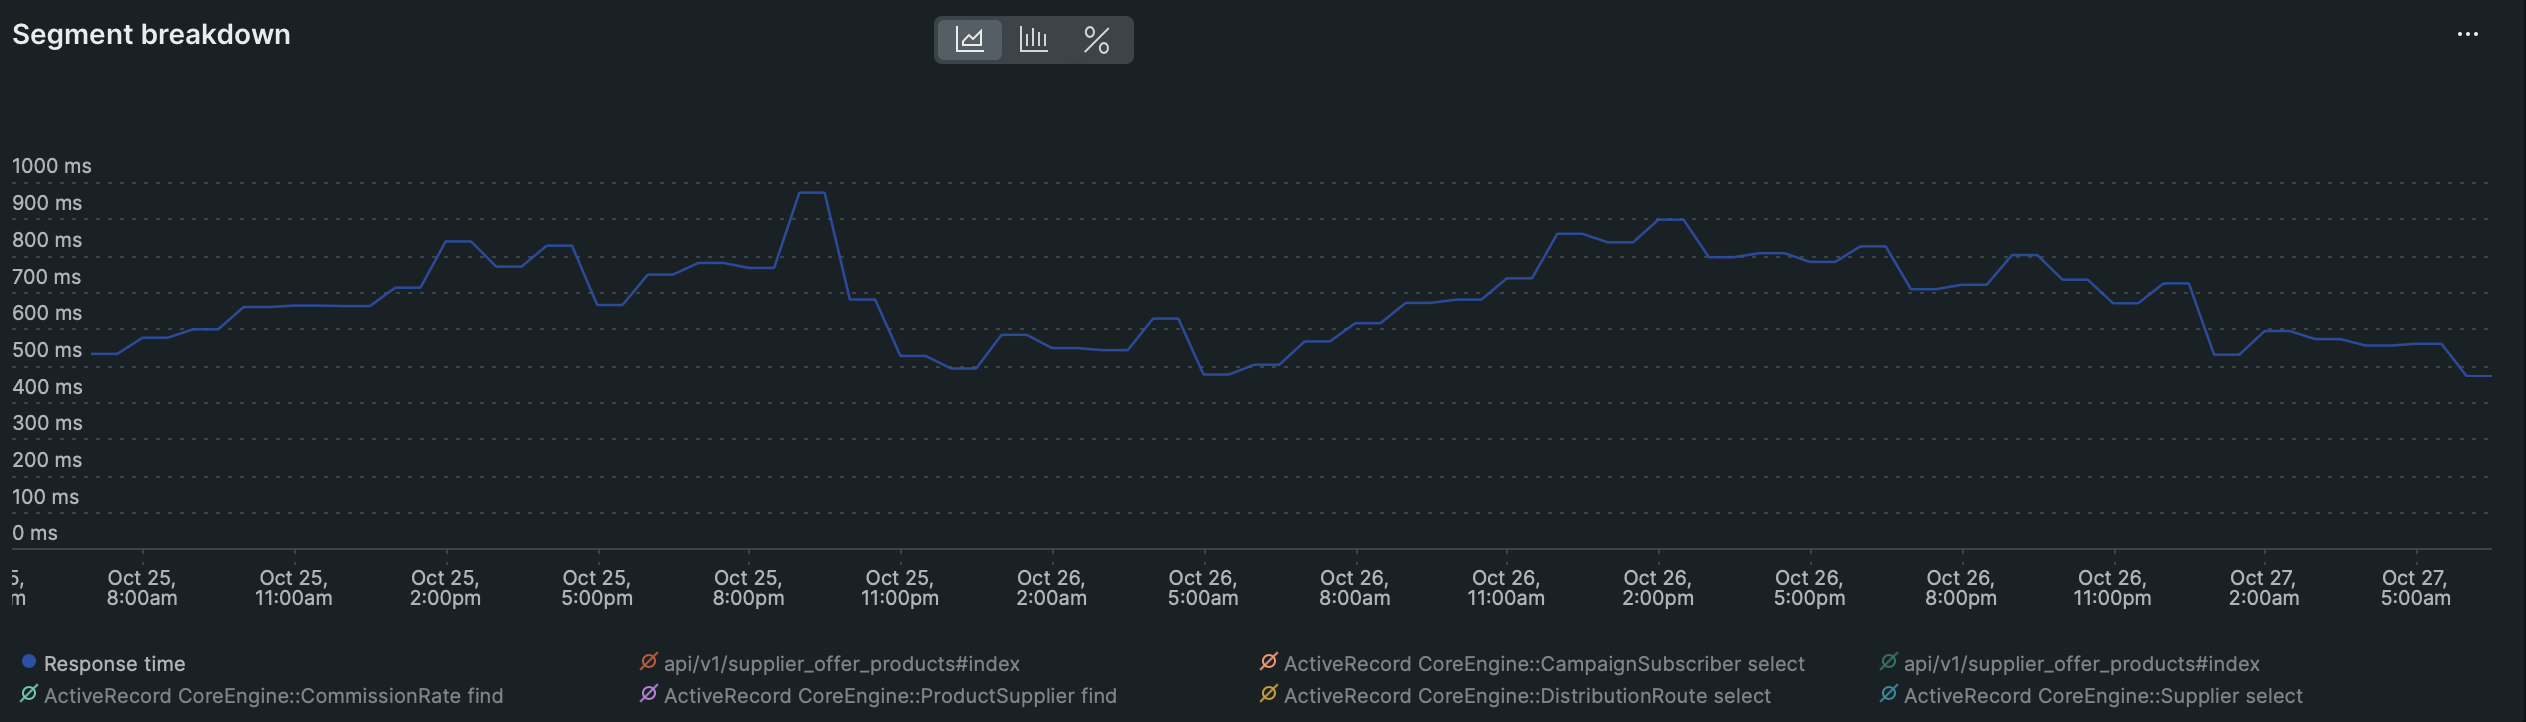
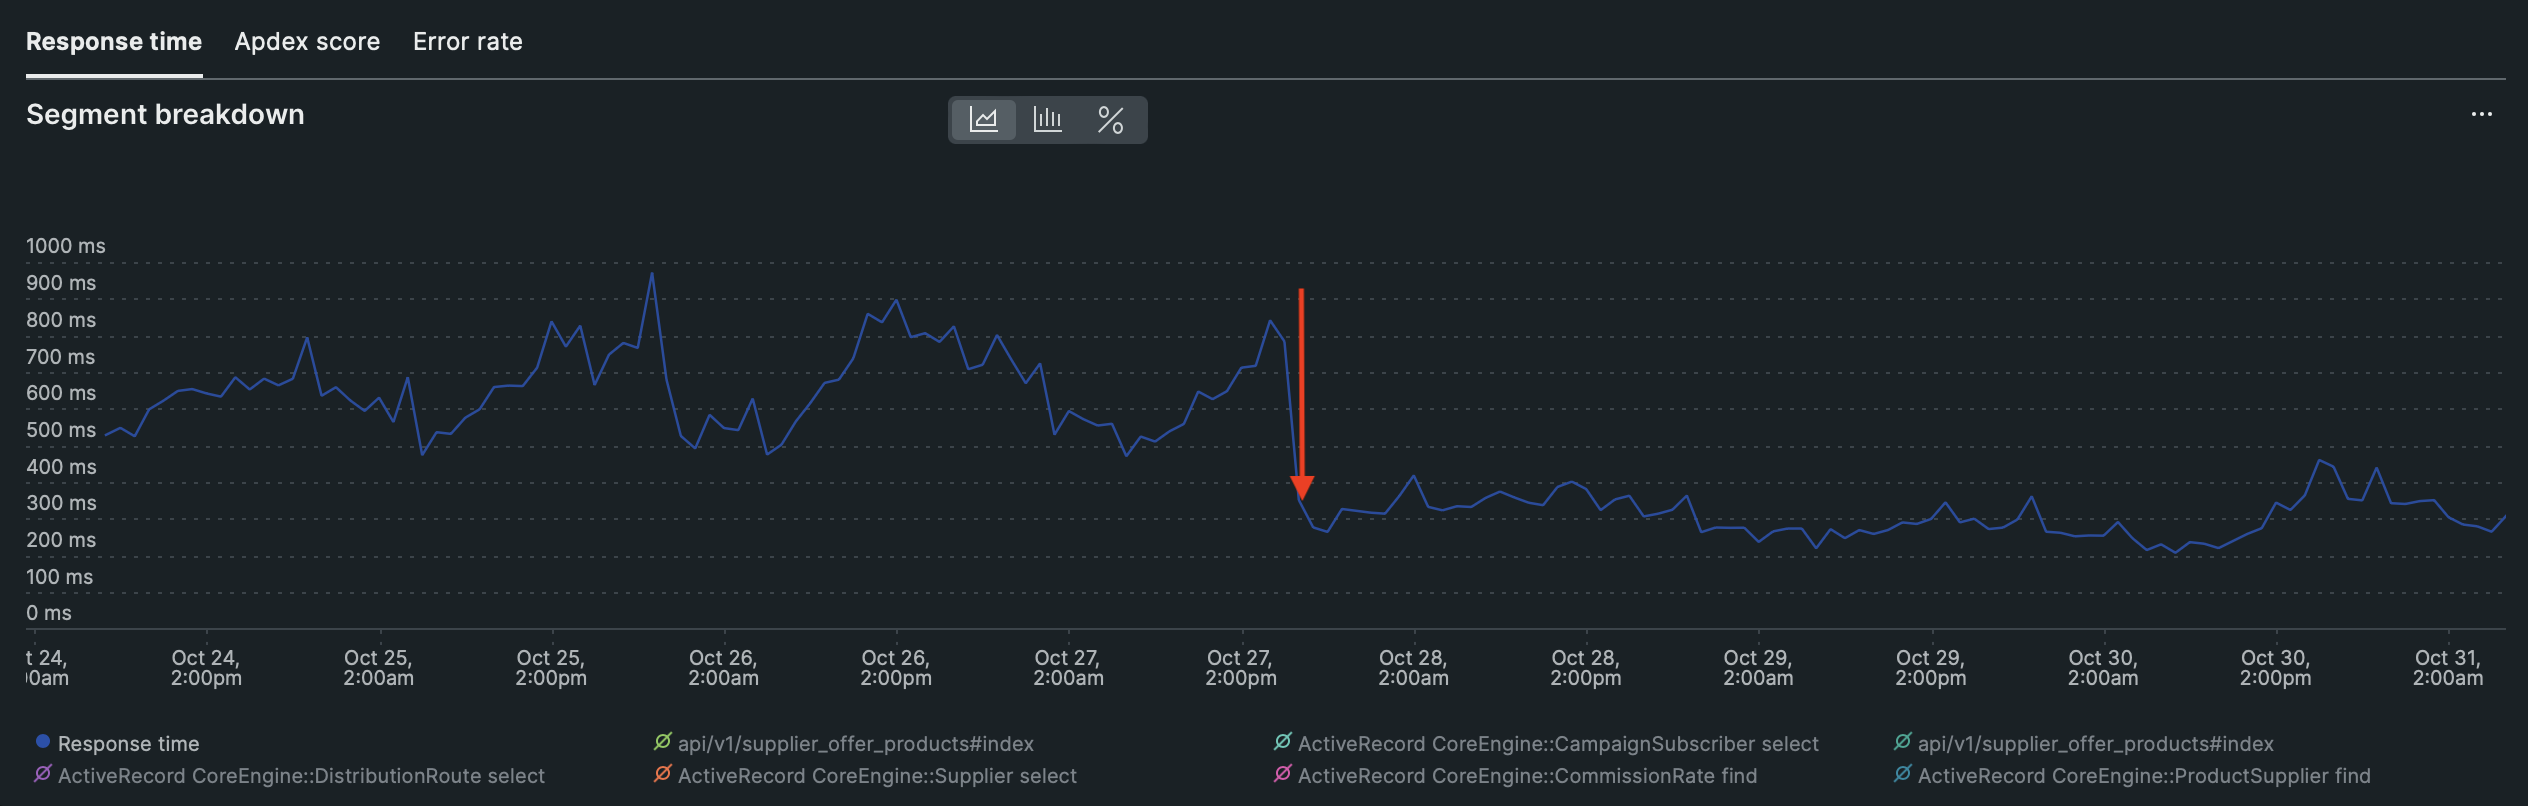
Below is the segment breakdown for the API response time through 2 days before deploying the fix, we can see that it doesn’t go below 500ms.
How To Detect N+1 Queries
Sentry
Sentry is an error tracking and performance monitoring platform which can be integrated with your rails application, I will leave resources below explaining how to integrate Sentry into your rails application [3, 4].
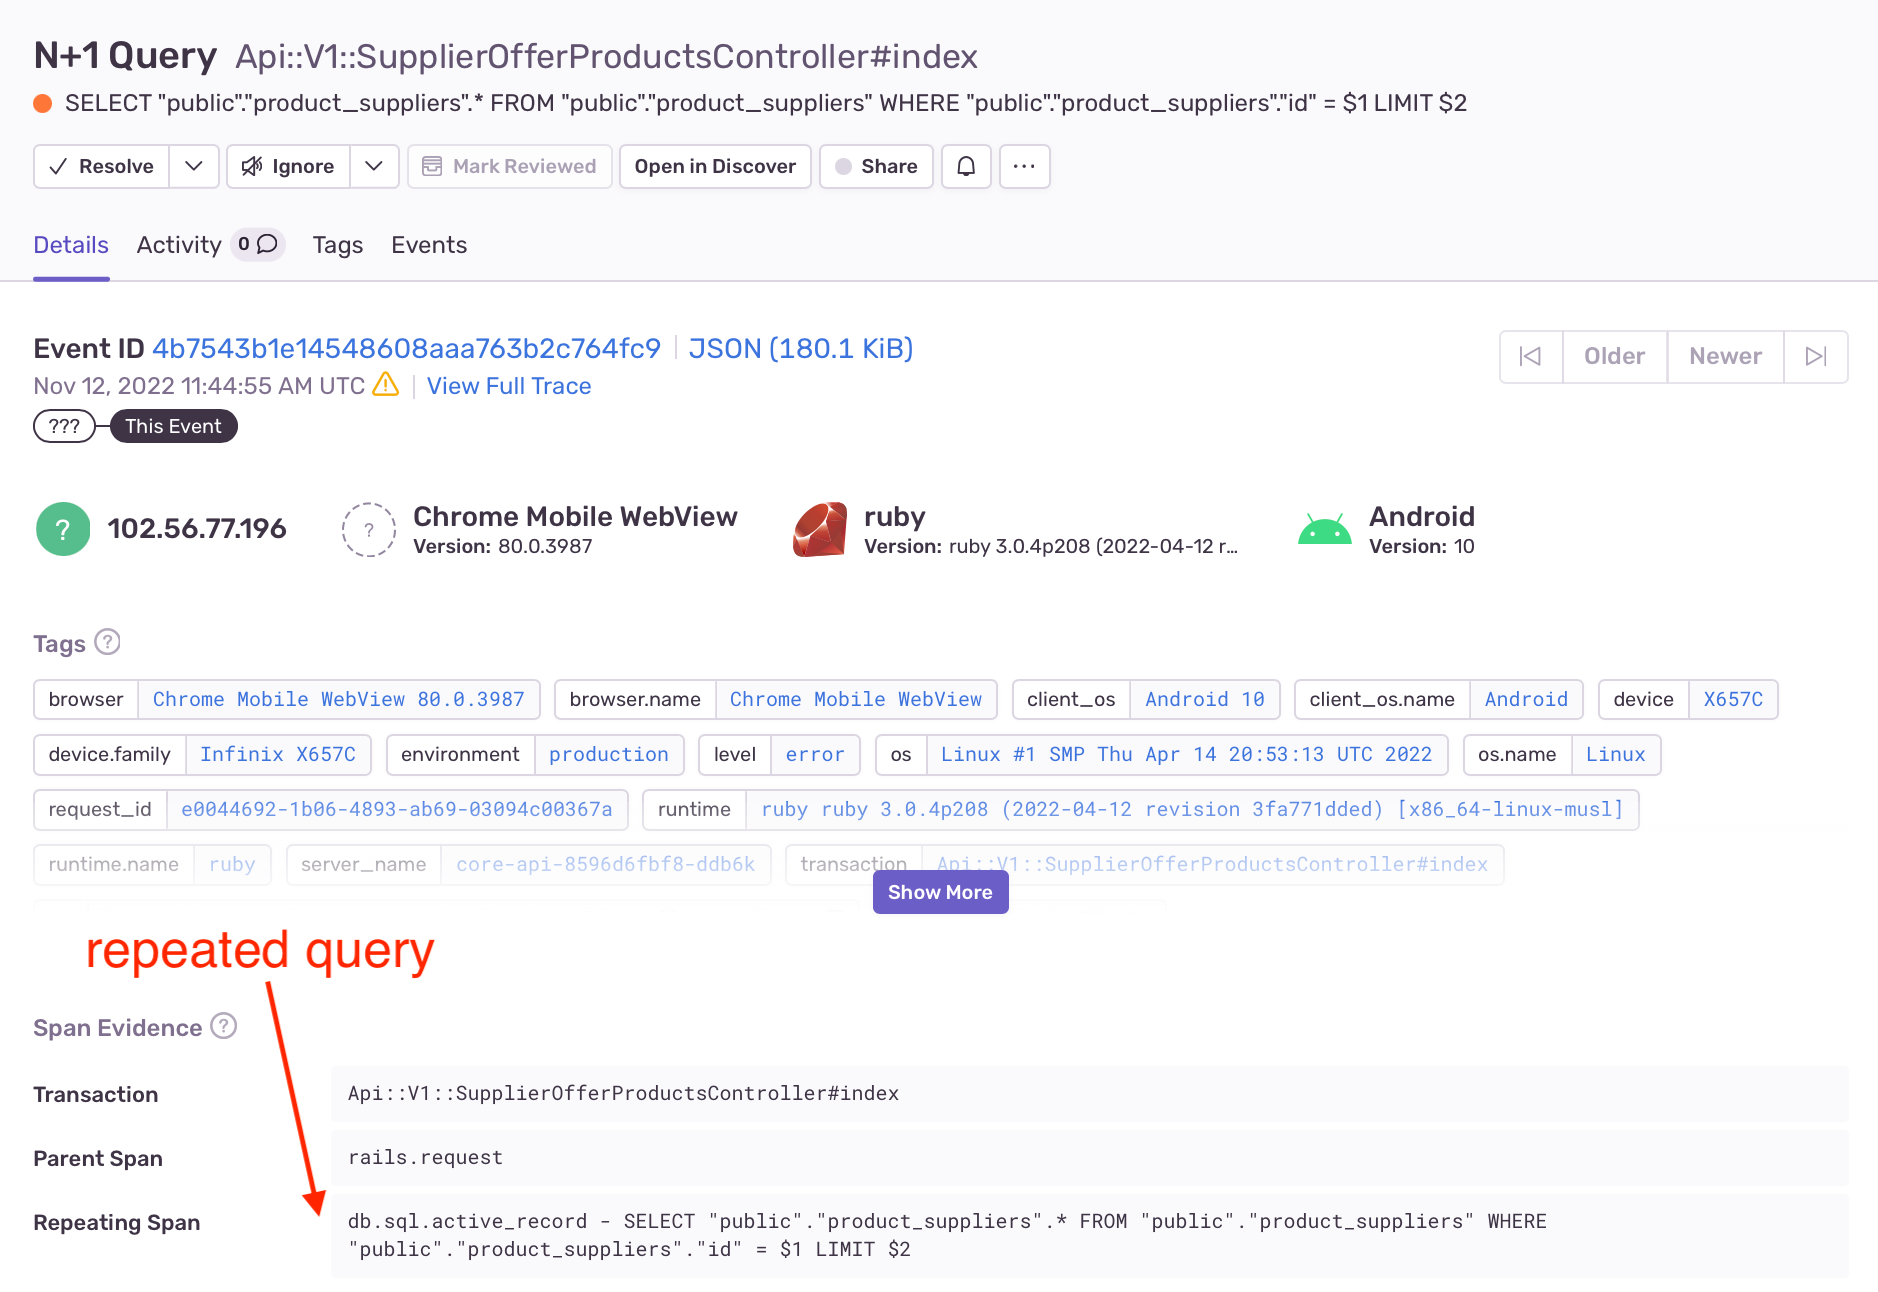
Sentry reported that our API is suffering from an N+1 query issue, and pointed out the repeated query as shown in the screenshot below:
NewRelic
Click on APM & Services from the left sidebar, then select the suspect API. Click on Transactions under the Monitor tab then select the API endpoint which appears to be on the top time consuming transactions. This will open a tab that contains transaction details about the selected API endpoint..

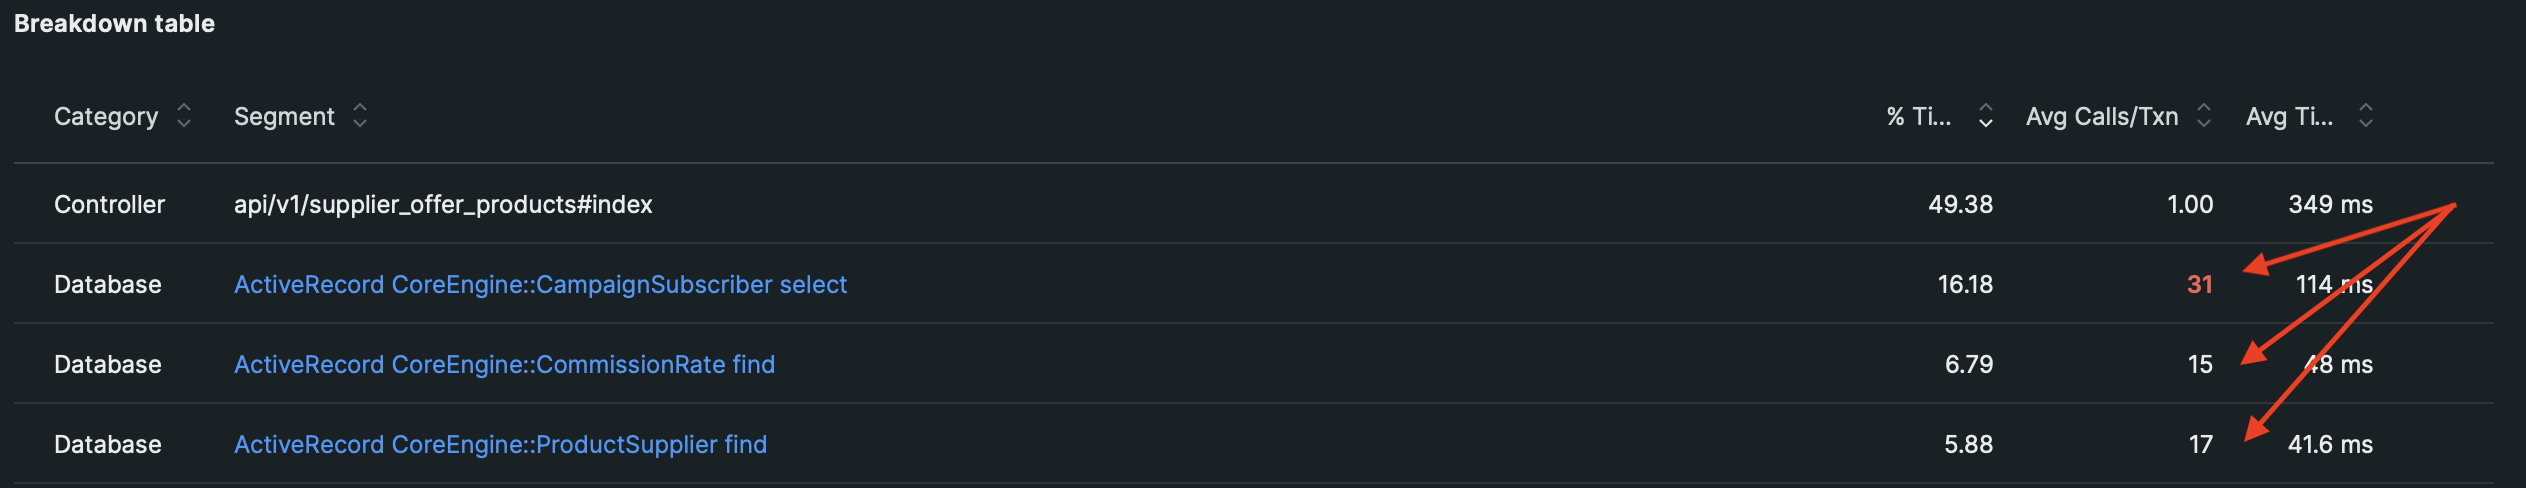
By viewing the break down table for the database transactions in the API endpoint, it’s obvious that the pointed out queries are having high Avg. Calls/Transaction which is a symptom for N+1 queries.
Debugging N+1 Queries
Bullet Gem
To detect where exactly the N+1 query is happening in your code, bullet gem comes to the rescue [4]. It’s a gem that watches your queries while you develop your application and notifies you when you should add eager loading (i.e: eager loading is the process by which a query for one type of entity also loads related entities as part of the query, so that we don't need to execute a separate query for related entities), when you're using eager loading that isn't necessary. Integration with bullet gem is rather simple, the docs go through it very well so I’m not going to cover that in this article.
By enabling bullet gem and allowing rails_logger option, bullet will create a log file for you that records the stack traces for queries that suffer from N+1 query. After that, hitting the concerned API endpoint while enabling bullet gem, it logged the N+1 query with the stack trace as shown below.
2022-10-31 10:57:25[WARN] user: root
GET /api/v1/supplier_offer_products?supplier_id=9&branch_id=13&area_id=300&app_version=3.3.1
USE eager loading detected
  CoreEngine::SupplierOfferProduct => [:product_supplier]
  Add to your query: .includes([:product_supplier])
Call stack
  /app/engines/core-engine/app/models/core_engine/concerns/can_override_product_prices.rb:87:in `gross_selling_price'
  /app/engines/core-engine/app/services/core_engine/products/product_pricing_service.rb:118:in `each'
  /app/engines/core-engine/app/services/core_engine/products/product_pricing_service.rb:118:in `min_by'
  /app/engines/core-engine/app/services/core_engine/products/product_pricing_service.rb:118:in `block in load_and_merge_available_product_prices'
  /app/engines/core-engine/app/services/core_engine/products/product_pricing_service.rb:118:in `transform_values!'
  /app/engines/core-engine/app/services/core_engine/products/product_pricing_service.rb:118:in `load_and_merge_available_product_prices'
  /app/engines/core-engine/app/services/core_engine/products/product_pricing_service.rb:38:in `load_available_prices'
  /app/engines/core-engine/app/services/core_engine/products/available_products_and_prices_service.rb:41:in `load_available_prices'
  /app/app/controllers/api/v1/supplier_offer_products_controller.rb:40:in `get_offer_products'
  /app/app/controllers/api/v1/supplier_offer_products_controller.rb:20:in `index'
  /app/app/controllers/application_controller.rb:43:in `set_time_zone'
The log here shows the code trace that led to the N+1 query and which relation we need to include while fetching the resources .includes([:product_supplier]). We can see that there’s a loop as identified in the code trace transform_values!, which is a map function that loops on the resources and performs a hit to the database to retrieve a ProductSupplier record.
@product_supplier_prices_hash.transform_values! { |priceable_list| priceable_list.min_by(&:gross_selling_price) }
This line is sorting the prices based on gross_selling_price and the resources in @product_supplier_prices_hashdoesn’t include ProductSupplier relation and gross_selling_price is defined as follows:
def gross_selling_price
	product_supplier.gross_selling_price_for_price selling_price
end
So it performs a query to the database to retrieve the record and get gross_selling_price value from it. This happens on each product in the hash. If we check the method that retrieves SupplierOfferProduct records, we will find that it is missing .includes([:product_supplier]) to eagerly load the ProductSupplier records and have them ready in memory instead of querying the database on each SupplierOfferProduct.
def load_offer_products
    CoreEngine::SupplierOfferProduct
    .is_published
    .of_product_supplier(@product_supplier_ids)
    .available_from_supplier_or_campaigns(
       @route_ids.join(','), @retailer.supplier_class_ids.join(','), @retailer.active_campaign_ids
    )
end
Including the ProductSupplier relation by adding .includes([:product_supplier]) to the method eliminated the N+1 queries on this relation.
Avoid Adding Logic Querying Database in Serializer
For the other two queries, the problem was that we were returning the supplier info in the API response as shown below:
render  json: all_offer_products, current_retailer: @current_retailer,
        distribution_routes_mapping: @distribution_routes_mapping,
        include: [product supplier brand category]
It’s very important to be careful with what you return in your API response, as that will affect two things:
- response payload size
- response time
The supplier attribute is added to each SupplierOfferProduct returned but it wasn’t actually required in the API response as it gets called in the supplier page to list the products which are on sale by the supplier, so the supplier info is already fetched by another API call. However, let’s see what caused the N+1 queries.
Checking the SupplierSerializer there’s an attribute returned in the serialized object which is defined as follows:
attribute :cashback_info do
     ActiveModelSerializers::SerializableResource.new(
     CoreEngine::Suppliers::CashbackPercentageService.new(current_user.retailer, object).call,
         each_serializer: CashbackSerializer,
         root: 'cashback'
     )
end
What happens here is that we’re getting the cashback_info which is determined by the commission rate and the campaigns the supplier is subscribed to, those two relations weren’t eagerly loaded. So, for each SupplierOfferProduct we’re adding to it a serialized object of the Supplier hence the N+1 queries.
Conclusion
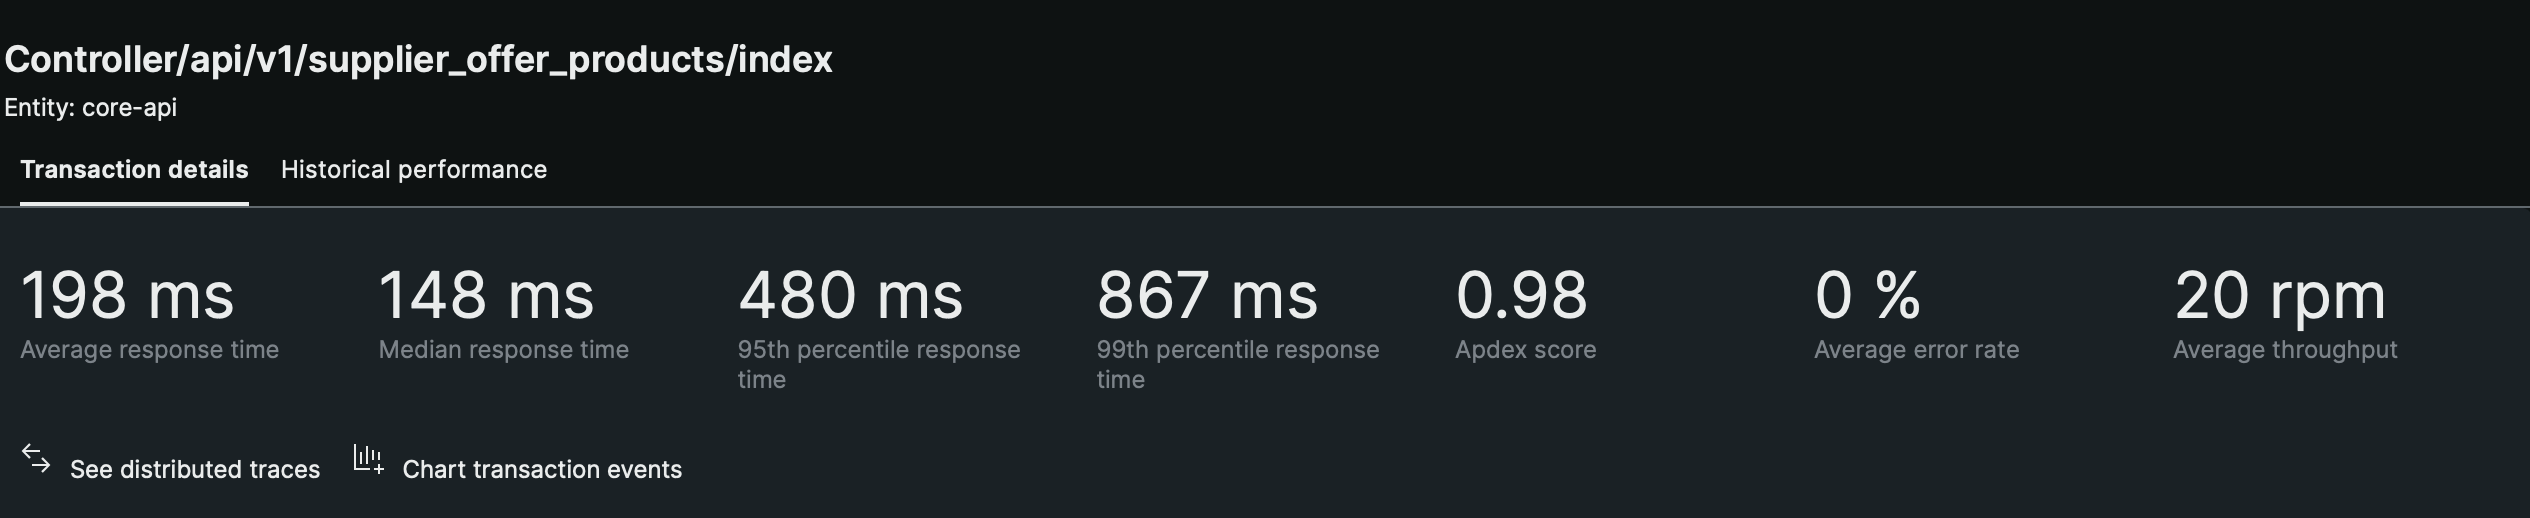
After eagerly loading ProductSupplier records and removing supplier attribute from the API response, the N+1 queries were completely eliminated and the API performance has increased significantly.
Checking the API performance on NewRelic before and after the fix we can see that the avg. response time decreased by 70% and Apdex score increased by 22%.
Looking at the segment breakdown for the response time below, we can see the drop in the response time after deploying the fix on 28th of October.
Takeaways
- It is very useful to have performance monitoring tools for your applications that will help you detect performance issues. By investigating and fixing these issues, your application performance can improve significantly.
- Make sure to eagerly load records needed and keep them in memory to avoid hitting the database and adding unnecessary latency to your API requests.
- Make sure to avoid adding unnecessary data to your API response.
- Make sure to avoid as much as you can adding logic that queries the database in your serializer.